
Construction rework costs the industry billions of dollars annually, and the root cause is almost always the same: deviations between what was designed and what was actually built go undetected until they compound into problems that are expensive to fix. 3D laser scanning for construction QA/QC catches these deviations early — when they can be corrected for hundreds of dollars instead of tens of thousands.
Deviation analysis is the specific workflow where scan data of the as-built condition is compared against the design model to quantify exactly where and by how much the actual construction departs from the intended design. This guide explains how the process works, what the deliverables look like, when to scan during construction, and what it costs.
How Deviation Analysis Works
The deviation analysis workflow has four steps: scan, align, compare, and report. Each step is straightforward in concept, but the quality of the result depends on the precision and methodology at each stage.
Step 1: Scan the As-Built Condition
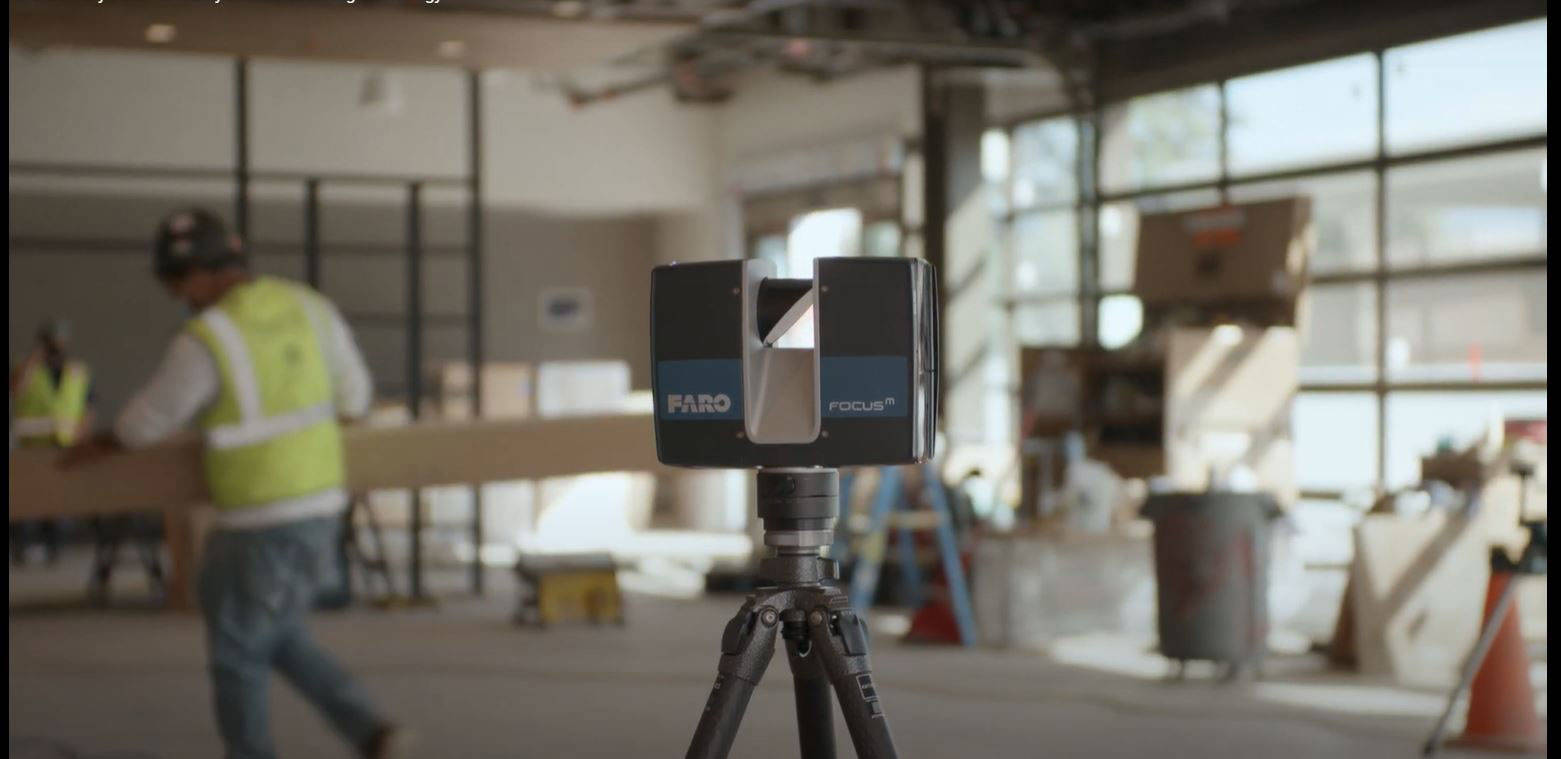
A 3D laser scanner captures the actual geometry of the construction as it exists at the time of the scan. This produces a point cloud — millions of measured points representing the real surfaces of walls, floors, columns, slabs, steel members, and MEP systems.
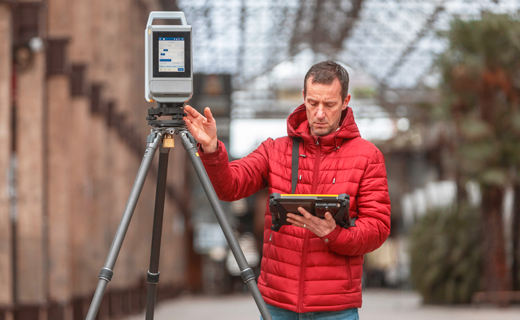
For construction QA/QC, the scan must be performed with a professional terrestrial scanner capable of accuracy appropriate for the tolerance being verified. Most construction verification work requires 2-5mm accuracy, which is well within the capability of instruments like the Leica RTC360 or Trimble X12.
The scan captures everything in its field of view — not just the elements being verified, but all visible construction. This comprehensive capture is valuable because it allows the QA team to investigate areas that were not specifically targeted, find unexpected deviations, and document the complete state of construction at that point in time.
Step 2: Align Scan Data to Design Model
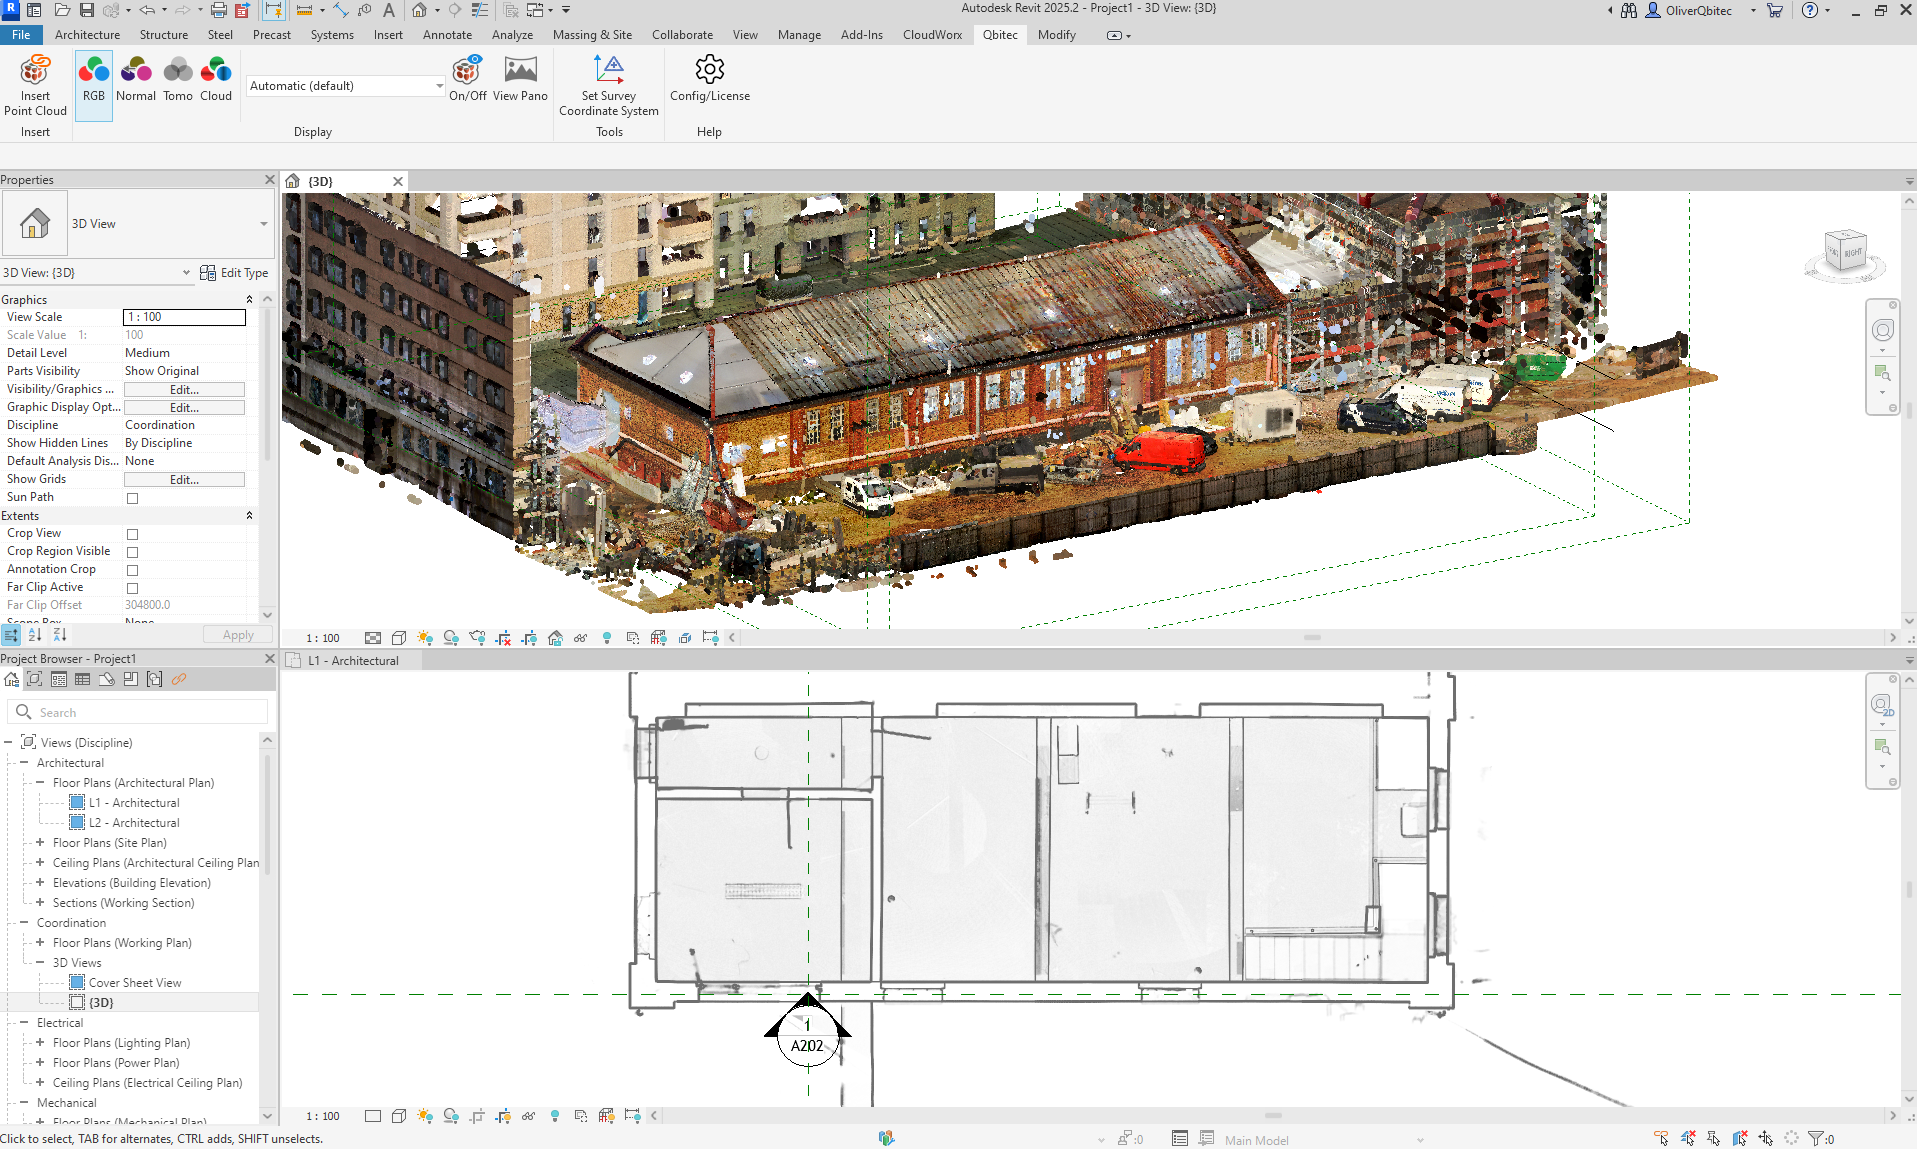
The point cloud from the field scan must be aligned to the same coordinate system as the design model. This alignment is critical — any error in alignment will appear as false deviation in the comparison.
Alignment methods include:
- Survey control points — Established control points on site that are referenced in both the scan data and the design model. This is the most reliable method and is standard for projects with tight tolerances.
- Feature-based alignment — Using known geometric features (column grid intersections, slab edges, established reference planes) to register the scan to the design model. This works well when control points are not available.
- Best-fit alignment — Mathematical optimization that minimizes the overall distance between the point cloud and the design model. Useful for quick assessments but can mask systematic errors.
For contractual QA/QC, survey control alignment is strongly recommended because it provides traceable, documented accuracy at the alignment stage.
Step 3: Compare Scan to Design
With the scan data and design model in the same coordinate system, deviation analysis software calculates the distance between every point in the scan and the nearest surface in the design model. The result is a deviation value for each measured point — positive if the construction is beyond the design surface (built too far out), negative if it is within (built too far in).
This comparison produces:
- Color-coded deviation maps — The point cloud or model surfaces are colored according to their deviation value. A typical color scheme uses green for within tolerance, yellow for approaching tolerance limits, and red for out-of-tolerance deviations.
- Statistical summaries — Mean deviation, standard deviation, maximum deviation, percentage of points within tolerance, percentage of points out of tolerance.
- Section analysis — Deviation mapped at specific cross-sections through the structure, showing where deviations are concentrated.
- Element-level reports — Deviation analysis for individual structural or architectural elements (each column, each wall panel, each slab pour).
Step 4: Report and Document
The deviation analysis deliverable is typically a report that includes:
- Summary of findings with pass/fail status against the applicable tolerance standard
- Color-coded deviation maps (plan views, elevation views, 3D views)
- Statistical analysis of deviation distribution
- List of specific out-of-tolerance conditions with their location, magnitude, and direction
- Recommendations for corrective action where applicable
- Documentation of scan methodology, alignment method, and accuracy verification
Color-Coded Deviation Maps

The deviation map is the most immediately useful deliverable from the analysis. It transforms millions of individual deviation measurements into a visual representation that engineers, architects, and contractors can interpret at a glance.
A typical deviation map color scheme:
| Color | Meaning | Typical Range |
|---|---|---|
| Dark blue | Significantly under-built | Beyond -25mm |
| Light blue | Under-built | -25mm to -10mm |
| Green | Within tolerance | -10mm to +10mm |
| Yellow | Approaching tolerance limit | +10mm to +20mm |
| Orange | At tolerance limit | +20mm to +25mm |
| Red | Out of tolerance | Beyond +25mm |
The color ranges are adjustable based on the project’s specific tolerance requirements. A structural steel project with tighter tolerances might use a green range of plus or minus 5mm, while a cast-in-place concrete project might use plus or minus 15mm.
When reviewing a deviation map:
- Large areas of green indicate construction that is within tolerance — these require no action
- Isolated red or orange points may indicate local defects (a formwork bulge, a misaligned embed, a bent reinforcing bar) that need specific correction
- Systematic color shifts across an entire element (an entire wall trending yellow to orange) indicate a positioning error that affects the whole element — this is more significant than isolated point defects
- Patterns in the deviation — consistent deviations at formwork joints, at pour boundaries, or at connection points — reveal construction process issues that should be addressed for future work
Tolerance Standards
Deviation analysis is only meaningful when measured against defined tolerances. Without a tolerance standard, the deviation data is informative but not actionable — you know how much something is off, but you do not know whether that amount matters.
Common Tolerance References
ACI 117 — Specification for Tolerances for Concrete Construction:
- Cast-in-place concrete walls: plus or minus 1/4 inch (6mm) per 10 feet of length
- Concrete columns: plus or minus 1/4 inch (6mm) from plumb per 10 feet of height
- Slab flatness: F-numbers (FF for flatness, FL for levelness) as specified
- Formed openings: plus or minus 1/4 inch (6mm) on each side
AISC Code of Standard Practice (Chapter 7) — Structural Steel:
- Column plumbness: 1/500 of the column height, maximum 1 inch (25mm)
- Beam elevation: plus or minus 3/8 inch (10mm) from design elevation
- Column base plate position: plus or minus 1/8 inch (3mm)
ASTM E1155 — Floor Flatness and Levelness:
- Specified using F-numbers (FF25/FL20, FF35/FL25, etc.)
- Higher numbers indicate flatter/more level floors
- Critical for flooring installations, warehouse operations, and equipment foundations
Project-Specific Tolerances: Many projects have tolerances tighter than industry standards, particularly for:
- Curtain wall and facade systems (connection point tolerances often plus or minus 3mm)
- Equipment foundations (machinery alignment may require plus or minus 1mm)
- Clean rooms and laboratories (floor levelness and wall plumbness requirements may exceed standard construction tolerances)
The tolerance standard should be established in the project specifications before construction begins, not after deviations are discovered.
When to Scan During Construction
The timing of QA/QC scans is strategic. Scanning at the wrong time wastes money. Scanning at the right time prevents problems.
Critical Scan Points
1. After Foundation and Slab-on-Grade Verify that the foundation and slab positions, elevations, and dimensions match the design before structural steel or framing begins. Deviations at the foundation level compound upward through every subsequent floor.
2. After Structural Steel Erection (per floor or zone) Verify column plumbness, beam elevations, and connection locations before concrete decks are poured or cladding systems begin. Structural steel deviations that are found before the deck pour can often be corrected. After the pour, they are permanent.
3. After Concrete Pours (each floor) Verify slab flatness, levelness, edge positions, and opening locations before MEP rough-in begins. Slab deviations affect MEP routing, ceiling heights, and flooring installations.
4. After MEP Rough-In (before walls close) Verify that mechanical, electrical, and plumbing systems are installed in the correct locations before walls are closed with drywall or other finishes. Conflicts discovered after wall closure are dramatically more expensive to resolve.
5. Before Curtain Wall or Facade Installation Verify that the structural frame is within tolerance at all curtain wall connection points. Curtain wall systems have tight tolerance requirements, and frame deviations outside these tolerances require costly remediation or custom fabrication.
6. At Substantial Completion A final as-built scan documents the completed construction for the owner’s records, verifies that all corrections have been made, and provides a baseline for facility management.
Scanning Frequency
The appropriate scanning frequency depends on the project’s risk profile:
- High-risk projects (tight tolerances, complex geometry, curtain wall systems, high-value finishes) — Scan at every critical milestone listed above
- Standard commercial projects — Scan at foundation, after each structural floor, and at substantial completion
- Low-risk projects (simple geometry, standard tolerances, experienced contractor) — Scan at foundation and at substantial completion
Cost of QA/QC Scanning
The cost of deviation analysis scanning varies by project size and the number of scan events during construction.
Per-Scan-Event Cost
Each scanning event (mobilization, field work, processing, deviation analysis, and reporting) typically costs:
- Small area (single floor, under 10,000 SF): $2,500 - $5,000
- Medium area (single floor, 10,000-50,000 SF): $4,000 - $10,000
- Large area (multiple floors or full building scan): $8,000 - $20,000
Total QA/QC Program Cost
For a typical mid-rise commercial building (10 floors, 200,000 SF), a comprehensive QA/QC scanning program with 6-8 scan events during construction typically costs $30,000 to $60,000 total. This represents approximately 0.1% to 0.2% of the construction cost — a fraction of the potential rework savings.
ROI of QA/QC Scanning
Industry research consistently shows that early detection of construction deviations reduces rework costs by 30-60%. For a project where rework would otherwise cost 5-8% of the construction budget, a QA/QC scanning program that significantly reduces rework pays for itself many times over.
The math is compelling: if a $30 million construction project experiences 5% rework without QA scanning ($1.5 million in rework costs) and 1.5% rework with QA scanning ($450,000 in rework costs), the scanning program saves over $1 million against a program cost of $40,000-$60,000.
Software for Deviation Analysis
Several software platforms support deviation analysis workflows. Our point cloud software comparison tool provides a detailed feature comparison, but the most commonly used platforms for construction QA/QC include:
- Verity (by ClearEdge3D) — Purpose-built for scan-to-design construction verification. Automates element identification and deviation reporting.
- Navisworks — Autodesk platform that supports point cloud overlay with design models. Widely used for clash detection and construction coordination.
- CloudCompare — Open-source platform with cloud-to-mesh distance calculation. Free but requires more manual effort than commercial alternatives.
- Leica Cyclone 3DR — Advanced analysis including surface comparison, cross-sections, and reporting.
Frequently Asked Questions
Can deviation analysis be done with photogrammetry instead of laser scanning?
Photogrammetry can capture exterior surfaces for deviation analysis, but it is less reliable than laser scanning for interior construction verification. Photogrammetry accuracy depends on lighting conditions, surface texture, and camera calibration — variables that are difficult to control on a construction site. For contractual QA/QC where deviations have financial and legal implications, laser scanning provides more reliable and defensible results.
Who performs the deviation analysis — the scanning company or the general contractor?
Either can perform the analysis, but the most common arrangement is for an independent scanning company to perform the scan and the analysis. This provides objectivity — the party verifying the construction is independent of the party performing the construction. Some general contractors have in-house scanning capabilities, but the QA/QC function benefits from independence.
How quickly can deviation analysis results be available?
For critical-path decisions, expedited processing can deliver preliminary deviation results within 24-48 hours of the field scan. Standard turnaround for a complete deviation analysis report with formatted deliverables is 5-7 business days. If the scanning is planned in advance and the design model is provided before the scan, processing times are shorter because the alignment and comparison can be set up before the field data arrives.
What happens when deviations are found outside tolerance?
The project team evaluates each out-of-tolerance deviation on a case-by-case basis. Options include: (1) correct the deviation if it is feasible and cost-effective, (2) accept the deviation with a design modification (a non-conformance report or engineering evaluation), or (3) remove and rebuild the affected element if the deviation is structurally or functionally unacceptable. The deviation analysis report provides the data needed for these decisions, but the decision itself involves the structural engineer, architect, and contractor.
Need construction QA/QC scanning for your project? Get a quote from THE FUTURE 3D for deviation analysis services using survey-grade equipment. Learn more about our 3D laser scanning for construction or explore how scanning supports as-built documentation across the project lifecycle.
Ready to Start Your Project?
Get a free quote and consultation from our 3D scanning experts.
Get Your Free Quote