Every licensed racing circuit undergoes regular safety inspection. The governing bodies — FIA for international motorsport, IMSA for North American sports car racing, NASCAR for stock car competition — require documented evidence that barrier systems, run-off areas, spectator protection, and track surface conditions meet their safety standards.
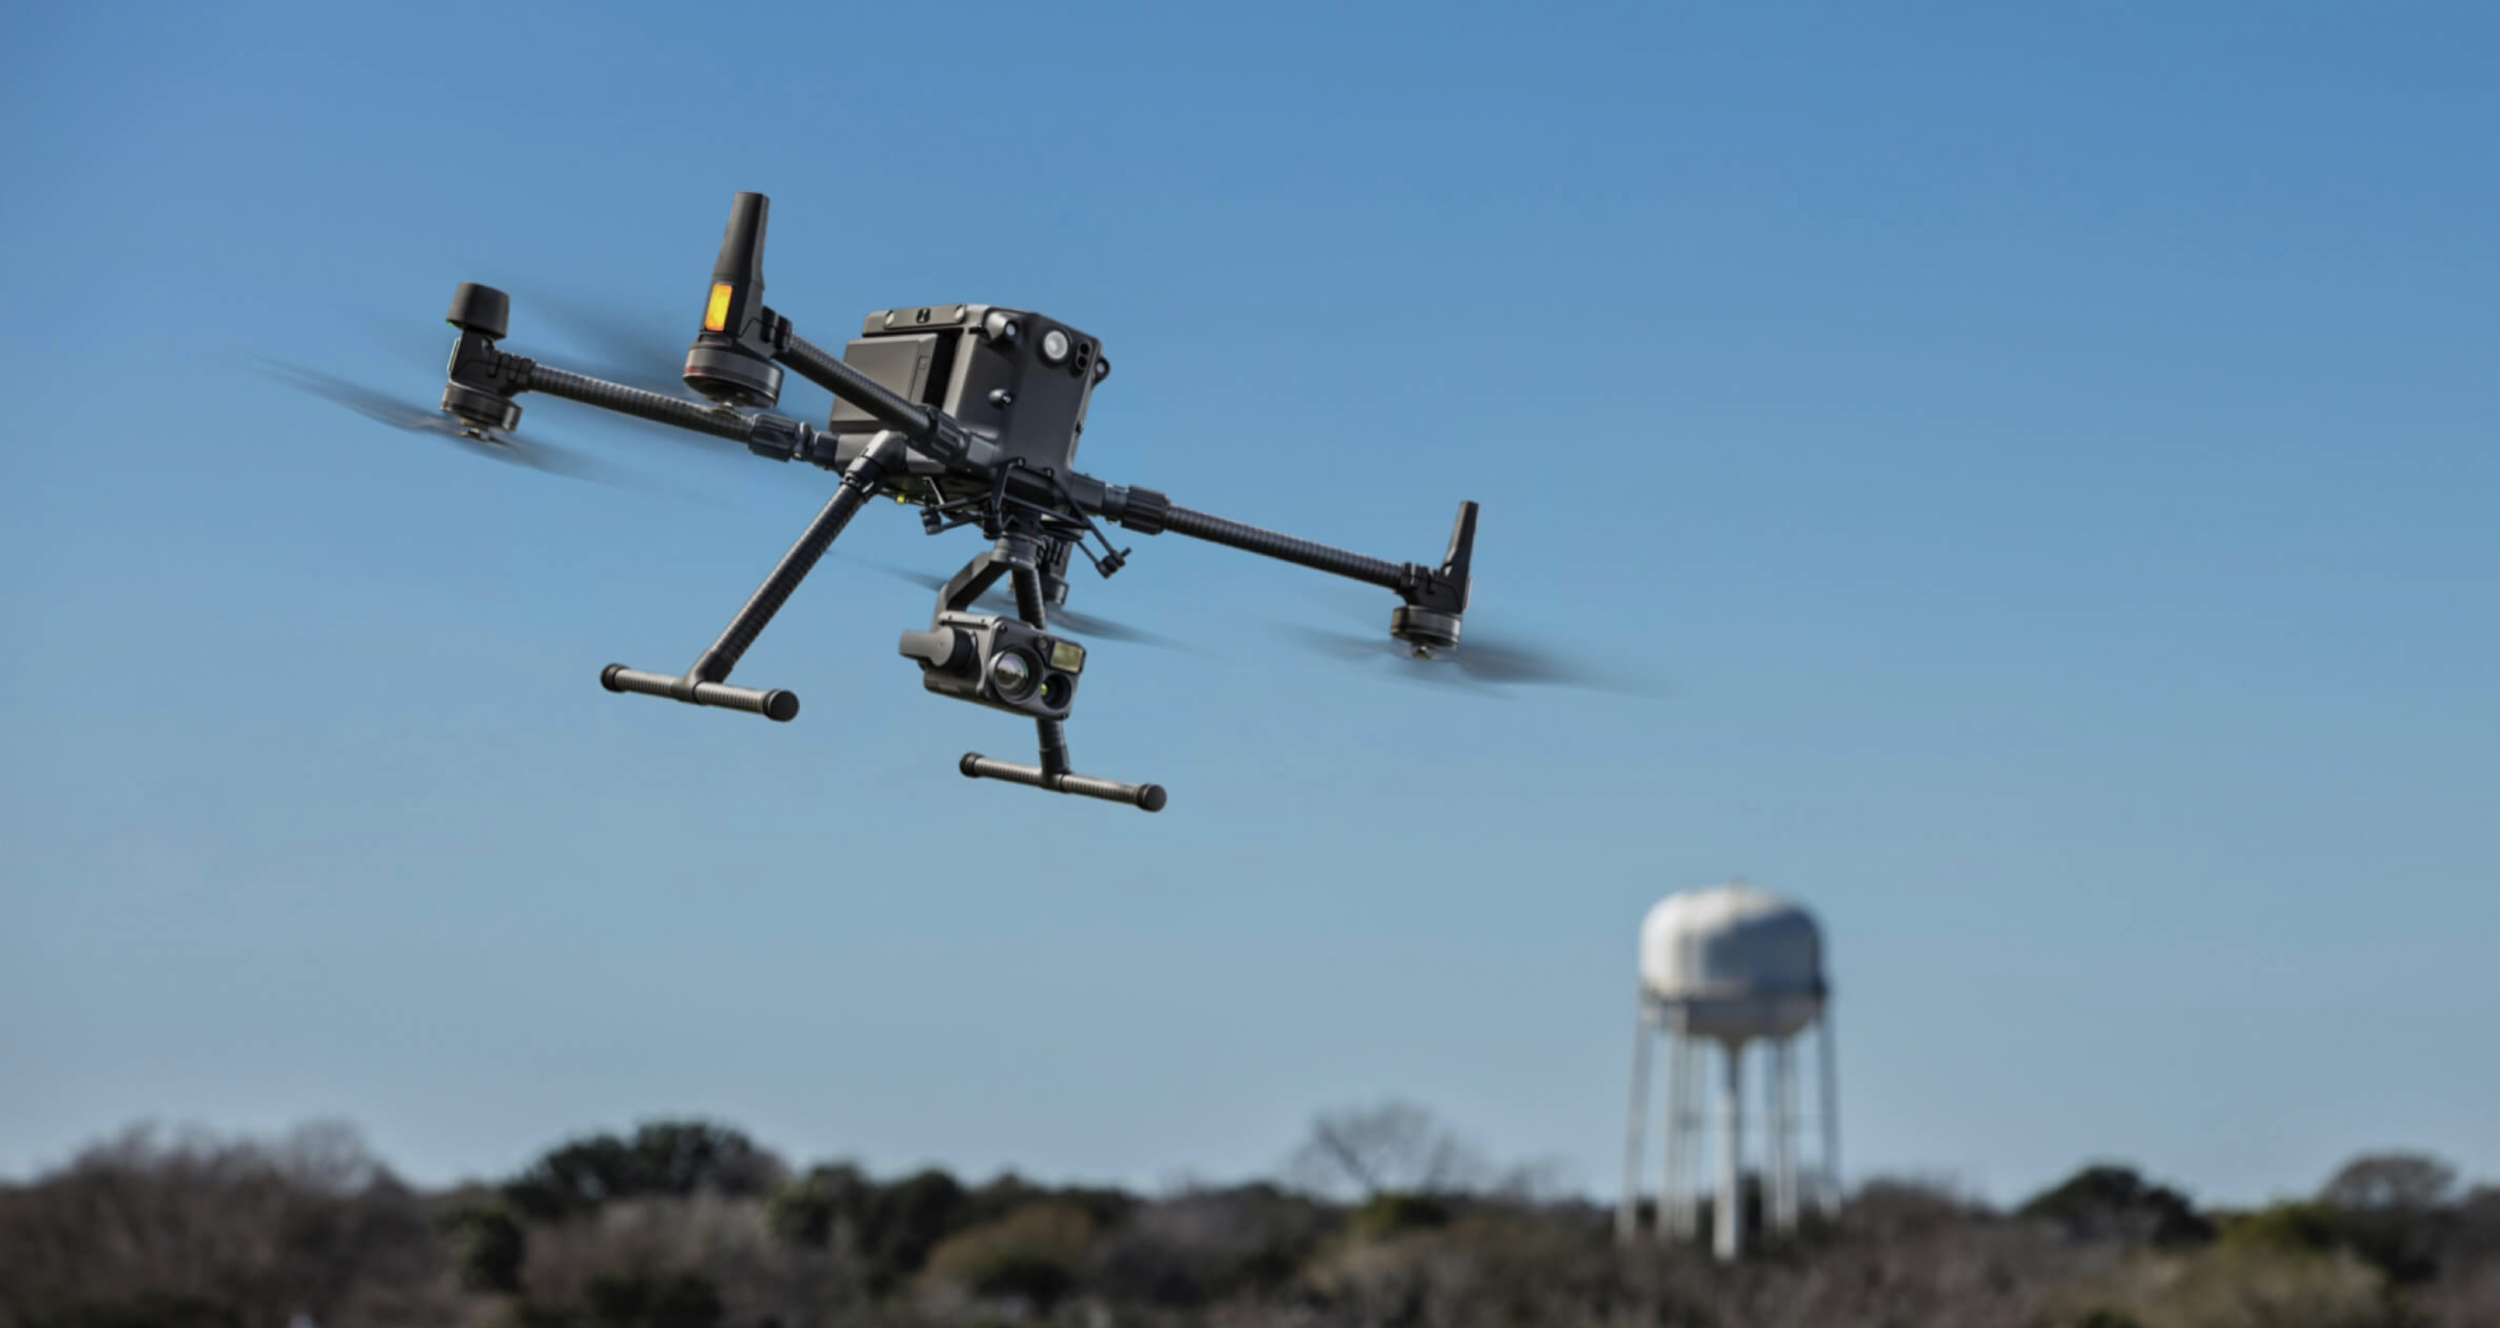
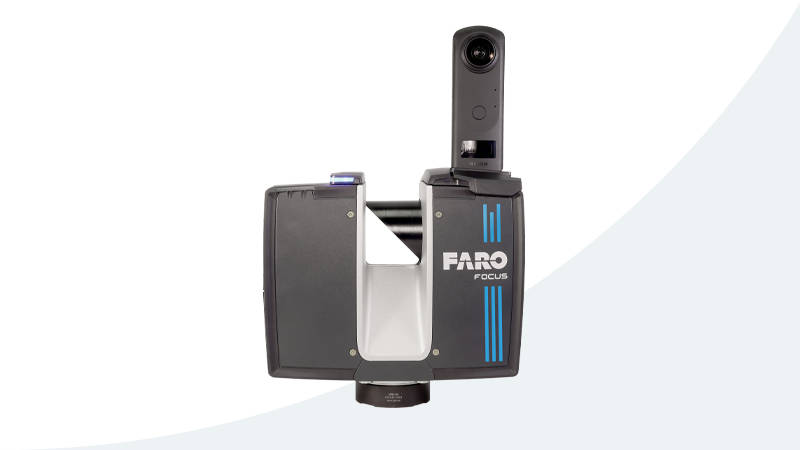
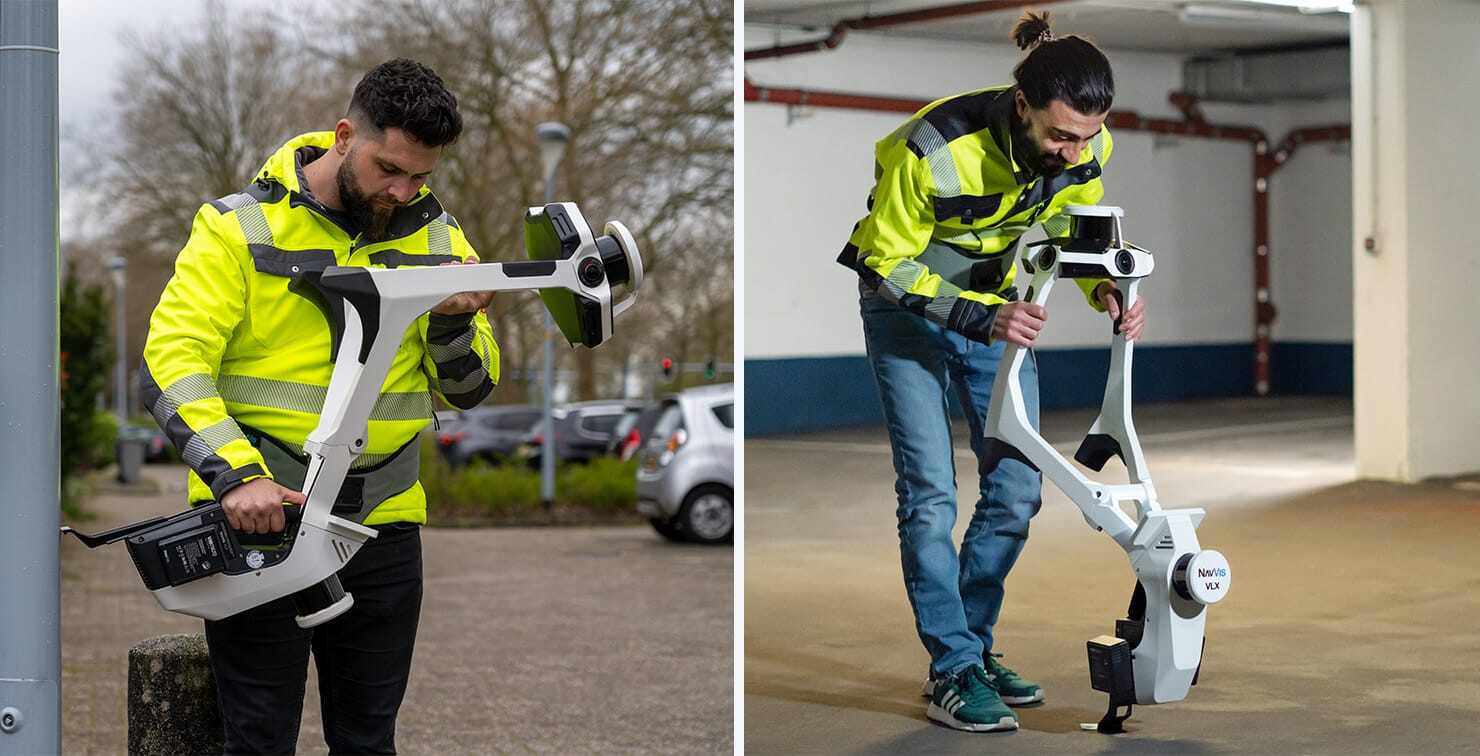
3D laser scanning and drone LiDAR provide the measurement resolution and comprehensive coverage that safety documentation demands. Instead of spot-check measurements at critical points, scanning captures the complete facility geometry, enabling automated analysis of every barrier section, every run-off zone, and every spectator-to-track clearance simultaneously.
FIA and IMSA Safety Requirements
Racing circuit safety standards are specified in technical regulations that define minimum requirements for:
Barrier Clearances
The minimum distance between the racing line and the nearest barrier at every point on the circuit. This clearance determines how much deceleration distance is available if a car leaves the track. Requirements vary by corner speed — high-speed sections require more run-off than slow corners.
Run-Off Areas
The surface, slope, and extent of the area between the track edge and the nearest barrier. Run-off areas must:
- Provide sufficient length for deceleration from expected impact speeds
- Slope correctly to assist deceleration (not accelerate the vehicle)
- Transition smoothly between surface types (asphalt, gravel, grass)
- Drain effectively to prevent standing water that reduces braking performance
Barrier Systems
The type, height, alignment, and connection details of every barrier section. Requirements specify:
- Which sections need TecPro absorbing barriers vs rigid barriers
- Minimum barrier heights
- Alignment angles that direct impacting vehicles along the barrier rather than into it
- Connection hardware that prevents barrier sections from separating on impact
Spectator Protection
The separation between spectators and the racing surface, including:
- Minimum distances from the track edge to spectator areas
- Barrier heights and types between the track and spectators
- Debris fencing height, mesh size, and structural support
- Emergency evacuation routes from spectator areas
Barrier Placement and Run-Off Area Verification
The core safety analysis from 3D scanning is the automated measurement of barrier clearances and run-off adequacy at every point on the circuit.
How Scanning Replaces Manual Measurement
Traditional track inspections rely on tape measurements and visual assessment at specific locations — typically the corner apexes and areas identified as high-risk. This approach has two limitations:
- Sparse measurement: Only specific points are measured. The areas between measurement points are assumed to meet requirements based on visual inspection.
- Static analysis: The measurements represent a single moment. If barriers shift, settle, or are damaged between inspections, the change is not detected until the next manual check.
3D scanning eliminates both limitations:
- The scan data measures clearances at every point along the circuit, not just at selected locations. A barrier section that encroaches on the minimum clearance by 50mm at a non-obvious location is detected automatically.
- Comparison between annual scans reveals any changes in barrier position, settlement, or displacement that occurred during the operating season.
Automated Clearance Analysis
The scan data enables computation of:
- Minimum clearance map: The shortest distance from the racing line to the nearest barrier at every point around the circuit, displayed as a color-coded map
- Non-compliance identification: Areas where the measured clearance falls below the regulatory minimum, flagged for engineering review
- Clearance trending: Year-over-year comparison showing areas where clearances are decreasing (barriers moving, settling, or being repositioned)
- Impact angle analysis: The angle at which a vehicle departing the track at each point would contact the barrier, identifying sections where barrier alignment should be adjusted
Track Surface Condition Monitoring
Beyond barriers, the track surface itself is a safety element:
Surface Deterioration
LiDAR data reveals:
- Crack patterns and crack widths (by comparing sequential scan data)
- Surface settlement and heaving
- Joint deterioration at construction seams
- Aggregate loss in the racing line (polishing and wear)
Drainage Verification
The Digital Terrain Model from the scan data shows:
- Surface grades at every point (does the surface drain correctly?)
- Depression areas that hold water
- Flow paths across the racing surface
- Drain inlet locations relative to flow paths
Standing water on a racing surface is an immediate safety hazard. The scan data provides the engineering basis for drainage improvements.
Spectator Safety Zone Documentation
Spectator safety extends beyond barriers to include the complete spectator experience:
Sightline Analysis
The 3D model of the circuit and grandstands enables sightline analysis:
- Do spectators have clear views of the track? (Affects where they stand or lean, which affects safety)
- Are there blind spots where a car could appear suddenly?
- Do sightlines encourage spectators to stand or lean in unsafe positions?
Barrier Height Verification
Spectator barriers must be tall enough to contain debris while allowing visibility. The scan data verifies:
- Barrier height at every section (not just spot measurements)
- Debris fence height and structural support positions
- Gap analysis at spectator crossover points
Emergency Evacuation Routes
The 3D model of spectator areas documents:
- Exit widths and capacities
- Route geometry (can stretchers/wheelchairs navigate the exits?)
- Distance to assembly areas
- Bottleneck identification at pinch points
Digital Twin for Emergency Response Planning
The complete 3D model of the circuit becomes a planning tool for emergency response:
Scenario Planning
Response teams use the digital twin to:
- Plan extraction routes from every section of the circuit
- Position medical vehicles for fastest response to any incident location
- Simulate multi-vehicle incident scenarios (track blockage, fire, spectator impact)
- Plan helicopter landing zones relative to the circuit geometry
Real-Time Operations
During events, the 3D model provides:
- A common spatial reference for all response teams
- Distance and route calculations for deployment decisions
- Infrastructure awareness (where are gates, access roads, medical facilities?)
Annual vs Event-Specific Scanning
| Scan Type | Scope | Purpose | Frequency |
|---|---|---|---|
| Annual inspection | Complete facility | FIA/IMSA homologation, baseline documentation | Once per year |
| Pre-event scan | Circuit configuration | Verify barrier positions for specific event | Each major event |
| Post-incident scan | Incident zone | Document barrier condition after impact | As needed |
| Post-modification scan | Modified area | Verify construction meets design | After any changes |
Annual Comprehensive Scan
The annual scan captures the complete facility for regulatory compliance. This is the baseline that all other scans are compared against. It includes:
- Full circuit track surface
- All barrier systems
- Spectator infrastructure
- Pit lane and paddock
- Site and access roads
Event-Specific Scan
For circuits that change configuration between events (chicane additions, DRS zone changes, temporary barrier modifications), an event-specific scan verifies that the current configuration meets the requirements for the specific series racing at the facility.
Frequently Asked Questions
Is 3D scanning required for track safety certification? 3D scanning is not explicitly required by FIA or IMSA regulations, but it is increasingly used by circuits to meet the documentation requirements. The comprehensive data quality from scanning exceeds the minimum requirements and provides stronger evidence of compliance.
How does scanning compare to traditional track inspection? Traditional inspection uses visual observation and spot measurements. Scanning captures complete geometry at every point. The two are complementary — the inspector’s experience and judgment are enhanced by the comprehensive measurement data that scanning provides.
What happens when scanning identifies a safety issue? The scan report flags non-compliant areas with specific measurements and locations. The circuit operator and governing body review the findings and determine remediation priorities. Critical issues (barrier clearance violations) are addressed before the next event. Non-critical issues are scheduled for off-season correction.
How much does annual track safety scanning cost? A comprehensive annual scan of a typical road course or oval costs $15,000-$40,000 depending on facility size and deliverable requirements. This is a fraction of the cost of barrier systems and run-off construction, making it a cost-effective investment in safety documentation.
Explore our motorsport circuit scanning services and as-built documentation capabilities. For the technology behind track scanning, read our racing circuit scanning technology guide.
Ready to Start Your Project?
Get a free quote and consultation from our 3D scanning experts.
Get Your Free Quote