The surface of a NASCAR oval is engineered to sub-inch tolerances. Banking angles, surface texture, drainage grading, and joint profiles all affect how 3,400-pound stock cars behave at 200+ mph. When the surface is repaved, the acceptance criteria are measured in millimeters. When the surface degrades, the symptoms — standing water, tire wear patterns, lap time variation — are directly traceable to surface geometry changes that 3D scanning can measure and document.
Track surface profiling with LiDAR and laser scanning provides the measurement resolution that racing demands. This guide covers why millimeter precision matters for oval tracks and how scanning technology delivers it.
Track Surface Quality and Racing Safety
An oval track surface is not flat. It is a precisely graded three-dimensional surface with:
- Banking angles: The superelevation through turns, typically 12-33 degrees depending on the track. Daytona and Talladega bank at 31-33 degrees. Bristol banks at 24-28 degrees. These angles determine cornering speeds and are safety-critical.
- Cross-slope: The lateral grade across the track surface that directs water toward the infield. Even on banked turns, the cross-slope must provide drainage while maintaining the designed banking profile.
- Longitudinal profile: The track surface elevation along the racing line. Subtle undulations create compression and extension forces on the car and affect aerodynamic performance.
- Surface texture: The asphalt aggregate profile that determines tire grip. This micro-geometry is measured at sub-millimeter resolution using profilometers.
How Surface Geometry Affects Racing
At 200+ mph, small surface variations have amplified effects:
- A 2mm bump at 200 mph generates a significant vertical force impulse that affects car handling and tire life
- A 0.5-degree banking variation across a turn creates differential side-loading that pushes cars toward the wall
- A 5mm depression in the racing line collects water that creates aquaplaning risk during wet conditions
- Surface texture changes between repaved and original asphalt create grip differential that catches drivers off-guard
Profilometers, Tribometers, and LiDAR
Three distinct measurement technologies address different aspects of track surface quality:
Profilometers — Microscopic Surface Scanning
Profilometers measure the micro-texture of the asphalt surface at sub-millimeter resolution. This data quantifies:
- Surface roughness parameters (Ra, Rq, Rz)
- Aggregate exposure profiles
- Polishing and wear patterns
- Texture depth changes over time
Profilometers are typically contact instruments or close-range laser devices that scan narrow strips of the surface. They provide the highest resolution data but cover limited area.
Tribometers — Friction and Wear Measurement
Tribometers measure the friction coefficient of the surface under controlled conditions. This data quantifies:
- Dry grip levels across the track
- Wet grip variation (critical for safety analysis)
- Friction change after resurfacing
- Surface deterioration over race weekends
LiDAR — Complete Surface Geometry
LiDAR scanning captures the complete track surface geometry at centimeter resolution across the entire facility. This data provides:
- Banking angle measurement at every point around the oval
- Surface elevation models for drainage analysis
- Volume calculations for repaving material estimates
- As-built documentation for construction verification
The three technologies are complementary. Profilometers and tribometers provide micro-scale data at specific locations. LiDAR provides macro-scale data across the entire track. Together, they give a complete picture of surface condition.
Pre and Post-Repaving Documentation
Track repaving is a multi-million dollar project that must meet strict engineering specifications. 3D scanning plays a critical role in both phases:
Pre-Repaving Survey
Before repaving begins, a complete LiDAR survey documents the existing surface:
- Baseline geometry: The current banking angles, cross-slopes, and longitudinal profile serve as the reference for the new surface design
- Problem documentation: Areas of settlement, cracking, drainage ponding, and surface deterioration are mapped in 3D
- Material volume calculation: The difference between the existing surface and the design surface gives the exact quantity of asphalt required
- Benchmark establishment: Survey control points are established around the track for construction control and post-paving verification
Post-Repaving Quality Assurance
After paving is complete, a second LiDAR survey captures the as-built surface:
- Banking angle verification: The scan data confirms that constructed banking angles match the design specification at every point around the oval
- Surface smoothness: The scan data reveals any bumps, dips, or irregularities in the new surface that exceed tolerance
- Grade verification: Cross-slopes and longitudinal grades are compared to the design
- Joint profiles: Construction joints between paving lanes are measured for smoothness and step height
The comparison between design and as-built — the difference map — highlights areas where the paving did not meet specification. This allows correction before the track is opened for racing.
Banking Angle Verification
Banking angles on NASCAR ovals are among the most critical geometric specifications in motorsport infrastructure:
| Track | Turn Banking | Tri-Oval Banking | Straightaway |
|---|---|---|---|
| Daytona | 31° | 18° | 0° |
| Talladega | 33° | 16.5° | 0° |
| Bristol | 24-28° | varies | 6-10° |
| Martinsville | 12° | varies | 0° |
| Charlotte | 24° | 5° | varies |
These angles are designed to specific tolerances. A 1-degree deviation from design on a 33-degree bank at Talladega significantly changes the forces on the car and the available grip level.
LiDAR scanning measures banking angles continuously around the track, producing a complete profile rather than spot measurements. This reveals:
- Banking transitions between turns and straights
- Banking variation within a single turn (some tracks have progressive banking)
- Asymmetry between turns that affects setup decisions
- Construction deviations from the design banking profile
Drainage Grading on Banked Tracks
Drainage on a banked oval is more complex than on a flat road:
The Challenge
Water on a 30+ degree banked surface experiences significant gravity-driven flow toward the inside of the turn. The surface must be graded so that water flows to collection points without pooling in the racing groove.
What LiDAR Reveals
The LiDAR surface model, processed through hydrology analysis, shows:
- Flow paths across the banked surface
- Depression areas where water accumulates
- Drainage inlet locations relative to flow paths (are they positioned to intercept the water?)
- Areas where banking transitions create reverse slopes that trap water
Why This Matters for Safety
Standing water on a NASCAR oval at racing speeds is extremely dangerous. The scan data provides the engineering basis for:
- Identifying drainage improvements needed before they cause incidents
- Verifying that drainage grading meets specification after repaving
- Planning supplemental drainage for problem areas identified in the scan data
Equipment for Track Surface Analysis
The equipment selection for oval track profiling depends on the required data:
| Application | Best Equipment | Resolution | Coverage |
|---|---|---|---|
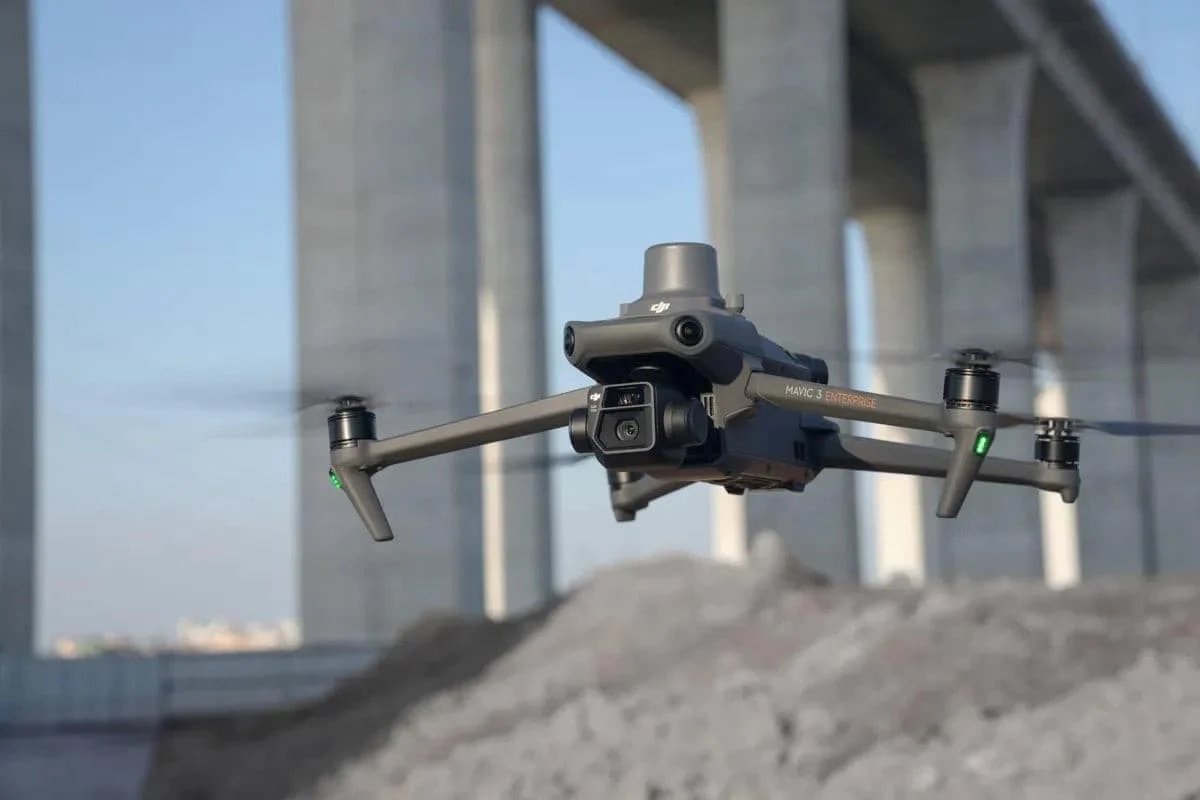
| Complete track geometry | Drone LiDAR (DJI M4E + L3) | ±20-50mm | Full track in 1-2 flights |
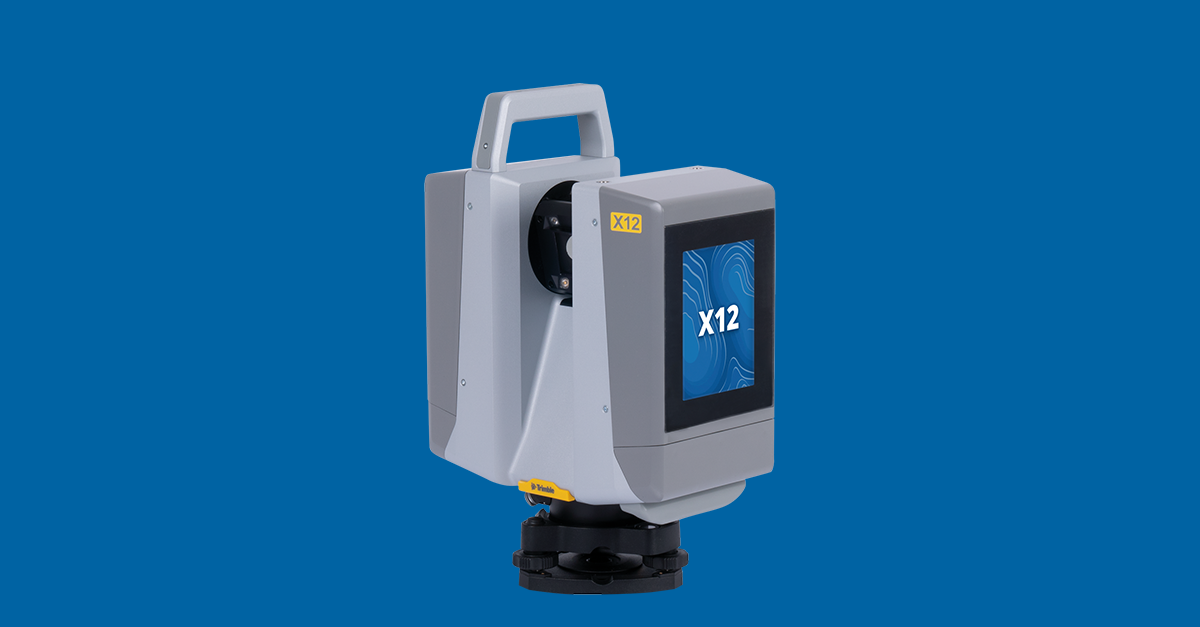
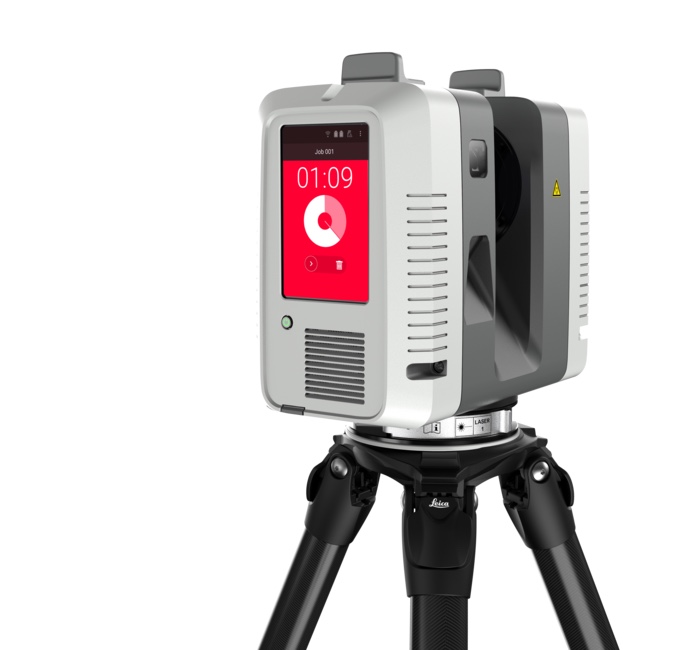
| Detail surface profiling | Terrestrial scanner (Trimble X12) | ±2-5mm | Specific zones |
| Micro-texture analysis | Contact profilometer | Sub-mm | Narrow strips |
| Friction measurement | British Pendulum Tester or similar | N/A | Point locations |
For most track documentation projects, the combination of drone LiDAR (complete coverage) and targeted terrestrial scanning (high-accuracy zones) provides the optimal balance of coverage and precision.
Frequently Asked Questions
How accurate does track surface scanning need to be? Banking angle verification requires ±0.1-degree accuracy, which translates to approximately ±2mm over a 1-meter measurement span. Terrestrial laser scanners meet this requirement. Drone LiDAR is suitable for overall surface profiling but not for the most critical banking measurements.
Can you scan a track during a race weekend? Scanning must be done when the track is clear of vehicles and personnel. At NASCAR events, scanning windows are limited to early mornings and late evenings between sessions. Off-season scanning provides the most comprehensive access.
How often should an oval track be scanned? Major facilities typically scan annually as part of their maintenance program. Post-repaving scans are mandatory for construction acceptance. Additional scans may be triggered by specific concerns (drainage issues, surface complaints, safety incidents).
What file formats are track scan data delivered in? Standard deliverables include E57/LAS point clouds, AutoCAD DWG/DXF surface files, Civil 3D TIN surfaces, and GeoTIFF raster surfaces. Banking angle profiles are typically delivered as Excel/CSV data referenced to track station markers.
Explore our motorsport circuit 3D scanning services and racing circuit scanning technology guide. For the full F1 scanning story, read how F1 circuits are 3D scanned.
Ready to Start Your Project?
Get a free quote and consultation from our 3D scanning experts.
Get Your Free Quote