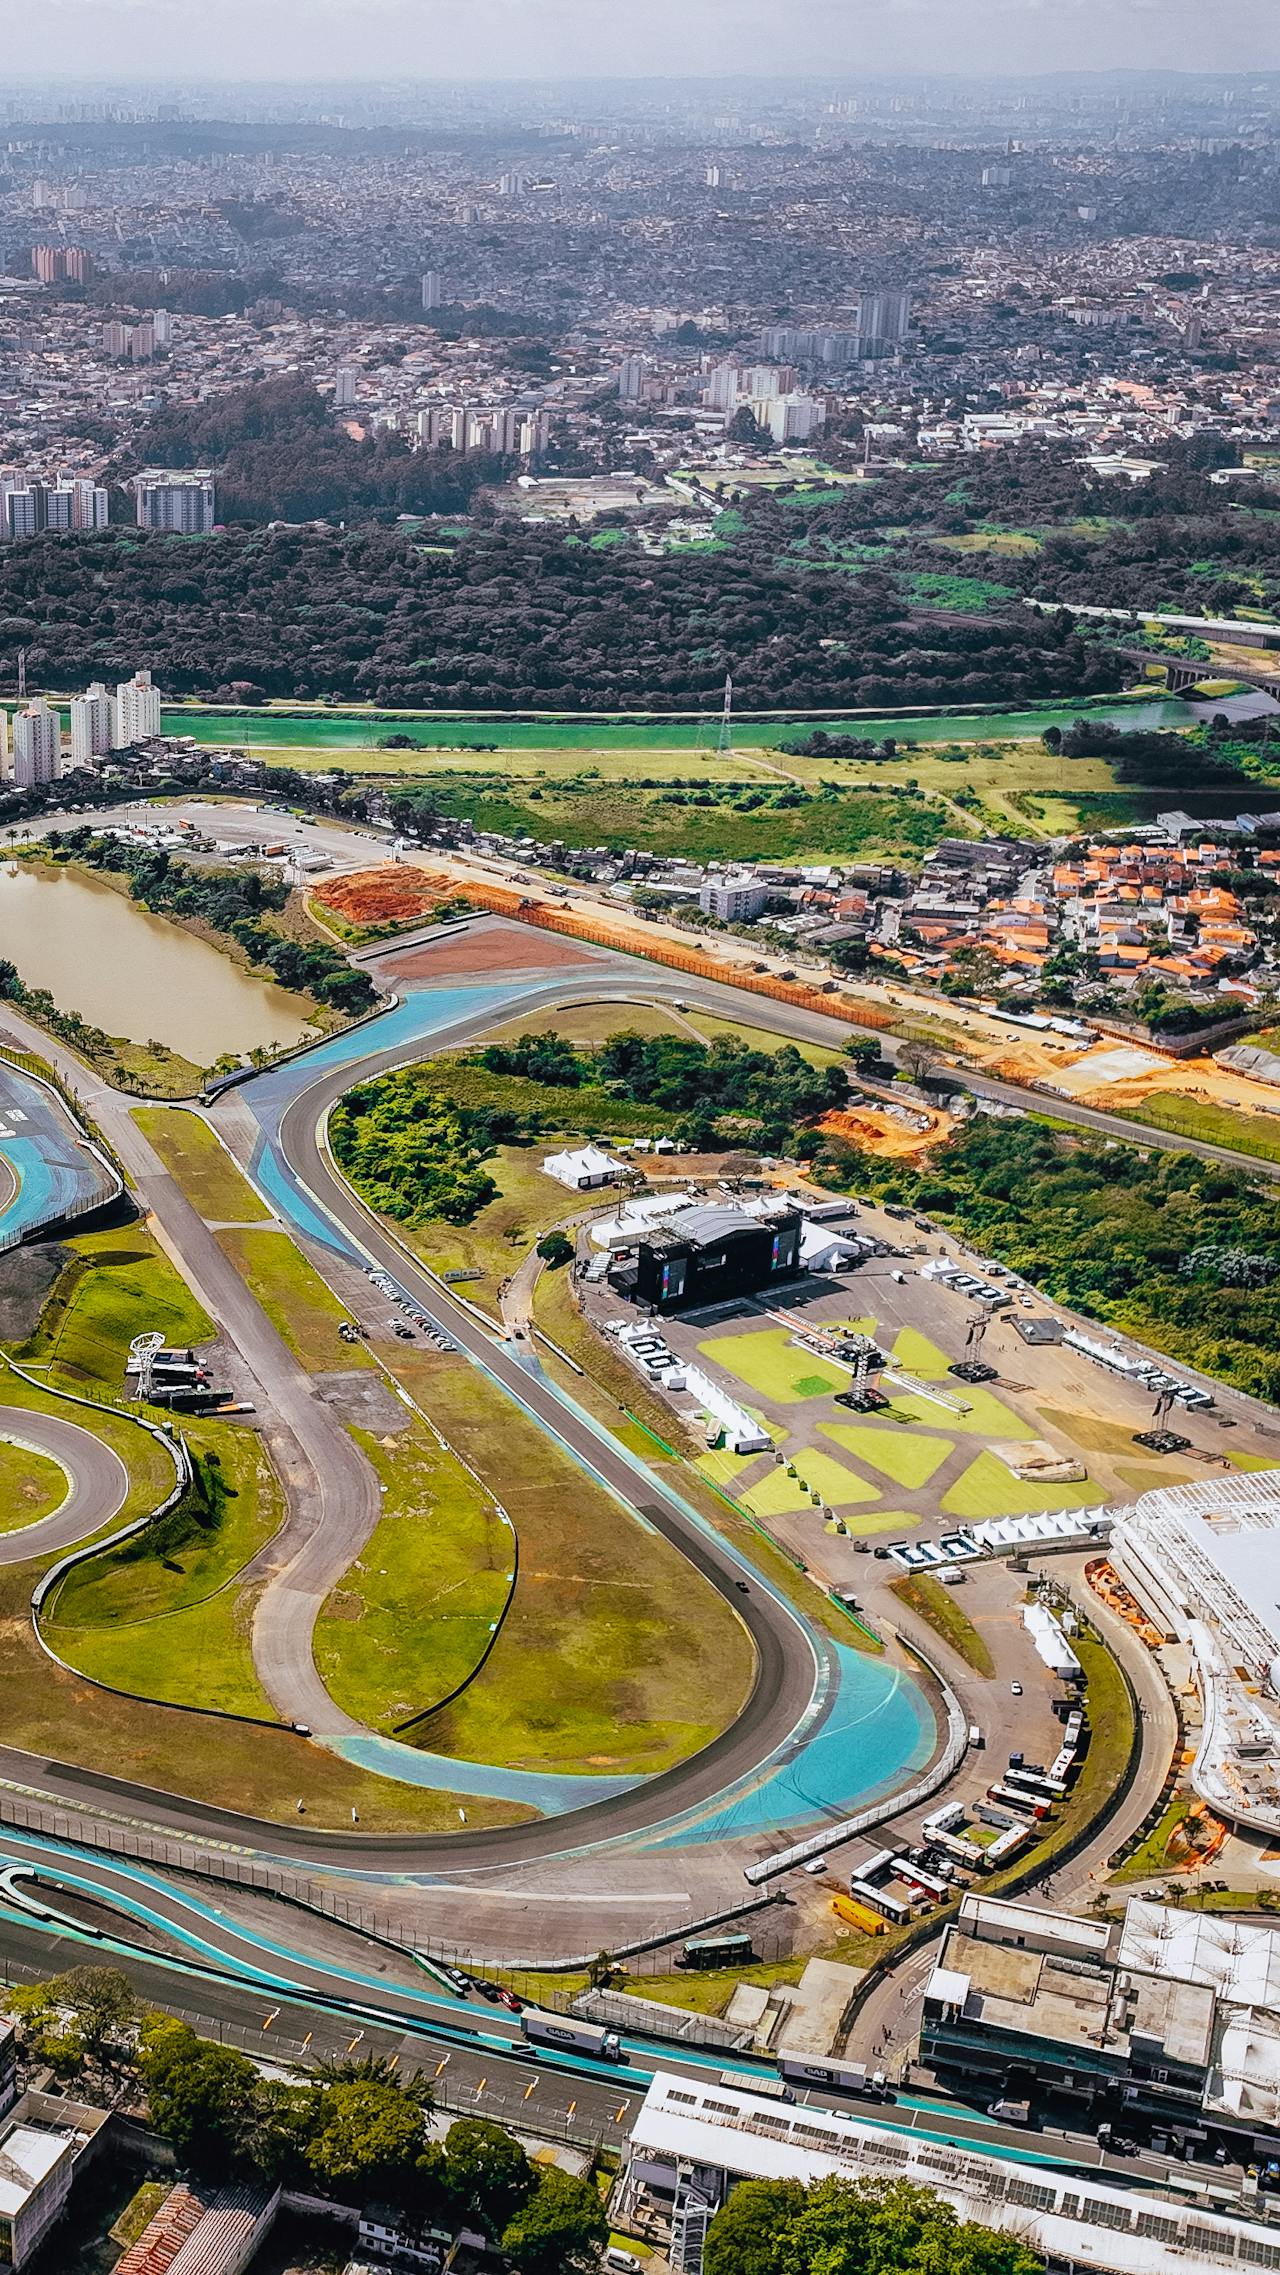
Every circuit on the Formula 1 calendar is 3D scanned using a combination of terrestrial laser scanners, drone LiDAR, and photogrammetry. The data is used for safety analysis, track maintenance, broadcast planning, and — most visibly — for creating the hyper-realistic digital environments in racing simulation software.
This guide covers how F1 circuits are actually scanned, what equipment is used, what data is captured, and what the scanning process reveals about the circuits that millions of fans watch every race weekend.
F1 Teams Scan Circuits During Grand Prix Weekends
Circuit scanning happens when the track is in full race configuration. This timing is essential because the scanning must capture the complete competitive environment — not just the asphalt, but the barriers, run-off areas, kerbs, pit lane infrastructure, and temporary structures that define the racing environment.
The scanning is typically coordinated between the circuit operator, FIA (the governing body), and the scanning service provider. Field teams work during non-session periods — early mornings, late evenings, and gaps between practice, qualifying, and race sessions.
Why Scan During Race Weekends?
The race weekend configuration is fundamentally different from the circuit’s normal state:
- Barriers are installed: TecPro barriers, tire stacks, and Armco rails are positioned specifically for the race event. These positions change between events and must be captured in the active configuration.
- Temporary structures are in place: Grandstands, hospitality suites, media centers, and team garages create the full venue environment.
- Track surface is current: Rubber deposits, surface wear, and micro-repairs are all captured in their actual racing-weekend condition.
- Infrastructure is operational: Timing loops, drainage systems, lighting, and broadcast infrastructure are all active and in their working positions.
Confirmed LiDAR-Scanned Circuits
Multiple public sources confirm LiDAR scanning across the F1 calendar. The following circuits have documented scanning programs:
Bahrain International Circuit
Desert environment with extreme temperature variation that affects track surface expansion and contraction. The LiDAR data captures precise banking angles on the fast corners and documents the extensive run-off area geometry. Sand management infrastructure — barriers, fencing, and grading designed to prevent sand encroachment onto the racing surface — is also captured.
Miami International Autodrome
Built around Hard Rock Stadium, the Miami circuit combines permanent track sections with temporary barriers on public roads. The urban environment creates complex scanning conditions with tall buildings, varied surface materials (asphalt, concrete, painted curbing), and significant elevation changes at the stadium section.
Melbourne Grand Prix Circuit (Albert Park)
A semi-permanent circuit through a public park that was significantly modified in recent years. The Albert Park layout was revised for the 2023 season with corner modifications, surface widening, and new DRS zones. Updated scan data captured the modified geometry, new surface materials, and revised barrier positions.
Suzuka International Racing Course
The only figure-eight layout in Formula 1, with the track crossing over itself via an overpass. The complex 3D geometry — including the elevation change through the Esses, the off-camber Spoon curve, and the banked 130R — makes Suzuka one of the most challenging circuits to scan accurately. LiDAR captures the precise spatial relationship between the crossover sections and the undulating terrain.
Autodromo Enzo e Dino Ferrari (Imola)
A historic circuit with blind corners and significant elevation changes. The LiDAR data captures the precise relationship between barriers and the racing line at critical points like Tamburello, Villeneuve, and Acque Minerali — corners where barrier proximity and run-off geometry are safety-critical.
What the Scans Capture
The data resolution and completeness of F1 circuit scanning exceeds what most commercial scanning projects require. This is driven by the safety implications — millimeters matter when barriers are positioned relative to racing lines used at 300+ km/h.
Track Surface Geometry
The primary deliverable is a complete 3D model of the track surface at sub-centimeter resolution:
- Longitudinal profile: The track centerline elevation over the full lap distance. Every hill, dip, and crest is captured. This data reveals the compression and extension forces that cars experience.
- Lateral profile: The cross-section at every point around the circuit. Banking angles, crown profiles, and surface camber are documented.
- Micro-surface texture: Asphalt aggregate patterns, surface roughness, rubber deposits, and joint/crack locations.
- Drainage geometry: The precise grading that directs water off the racing surface during wet conditions.
Kerb Profiles
Every kerb on the circuit is captured in 3D. Kerb design is a safety-critical element:
- Height above the track surface (typically 50-80mm)
- Width and profile shape (flat-top, serrated, or sausage kerb variants)
- Transition geometry where the kerb meets the track surface
- Positioning relative to the track edge line
Barrier Systems
The complete barrier infrastructure is documented:
- TecPro barrier positions, heights, and angular alignment
- Armco rail positions and attachment point locations
- Concrete wall positions and surface geometry
- Tire stack positions and stacking configurations
- Connection points between barrier types
Pit Lane and Infrastructure
The pit lane is scanned as a separate zone with its own accuracy requirements:
- Pit box dimensions and markings
- Speed limit line positions
- Entry and exit geometry (critical for safety during pit stops)
- Garage infrastructure positions
The Technology Stack
F1 circuit scanning uses the same multi-sensor approach as stadium scanning and other large-venue documentation projects:
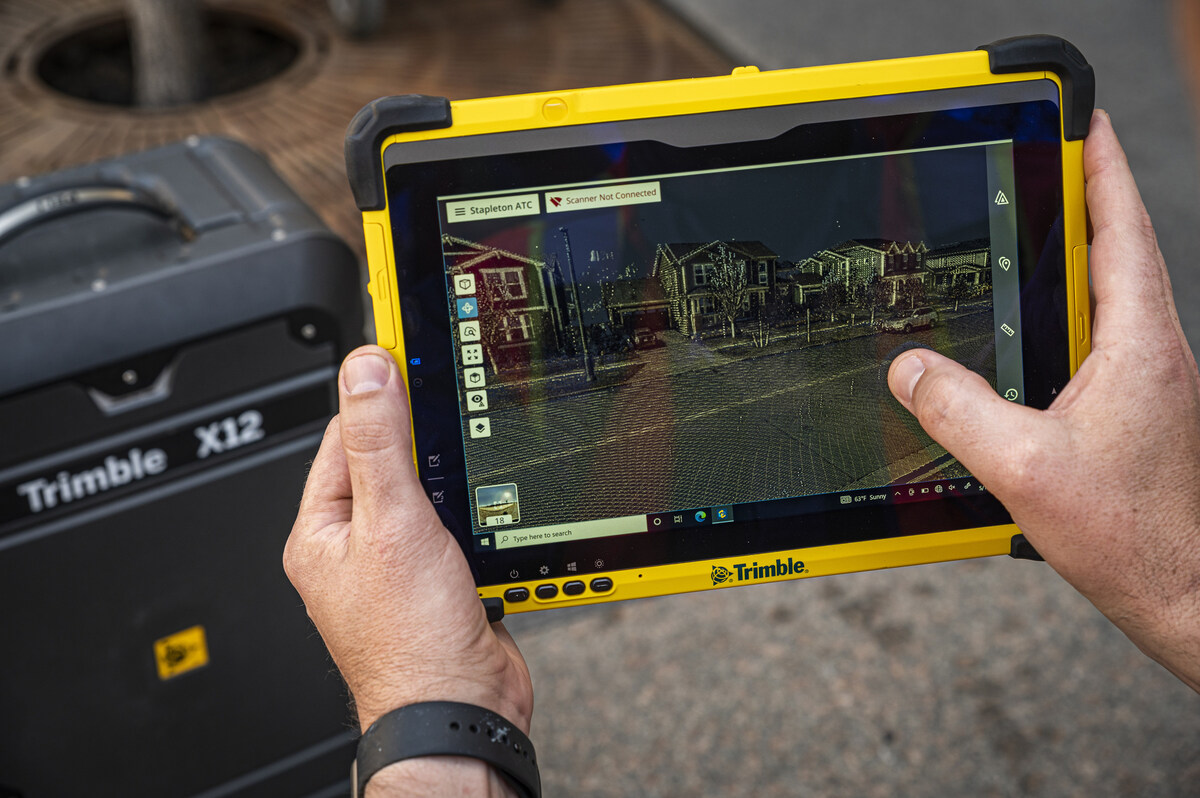
Terrestrial Laser Scanners
High-accuracy static scanners (Trimble X12, Leica RTC360, RIEGL VZ-600i) are positioned at intervals around the circuit to capture detailed geometry. The scan positions are concentrated at:
- High-speed corners where barrier proximity is safety-critical
- Kerb locations where accurate height measurement is essential
- Pit lane entry and exit zones
- Spectator-adjacent areas where barrier effectiveness must be verified
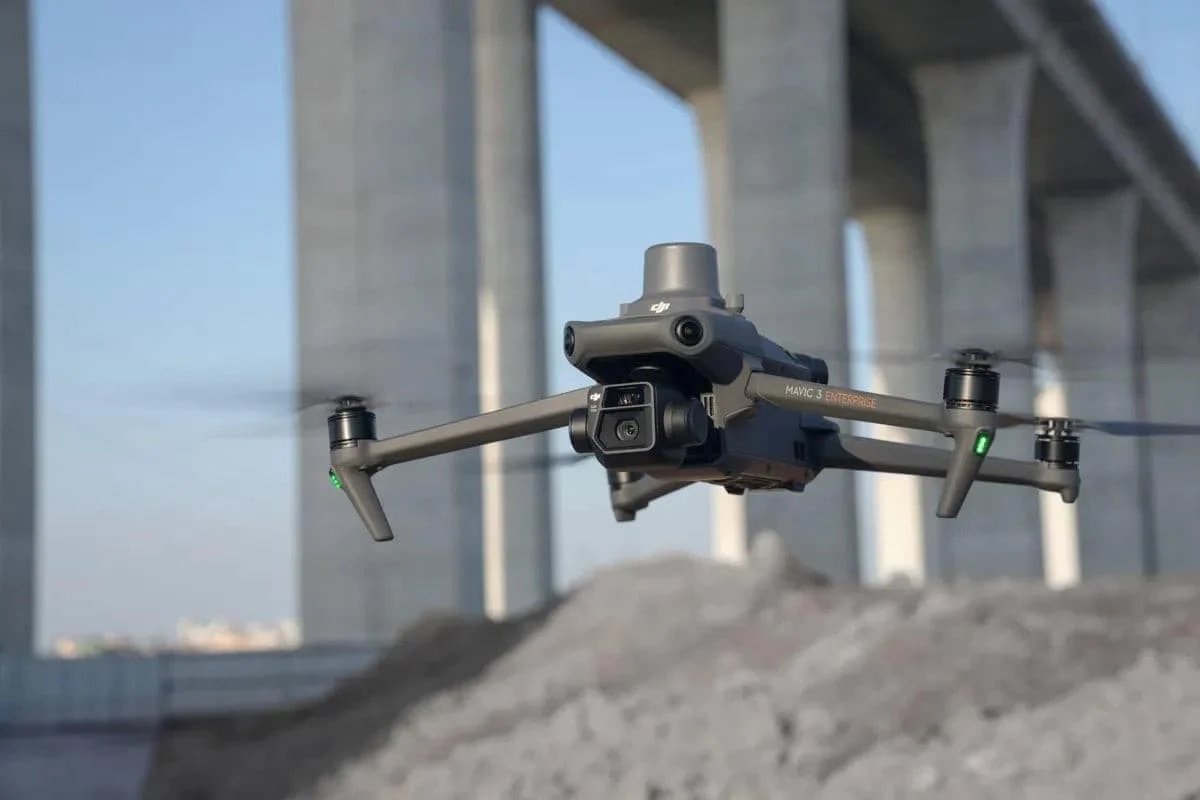
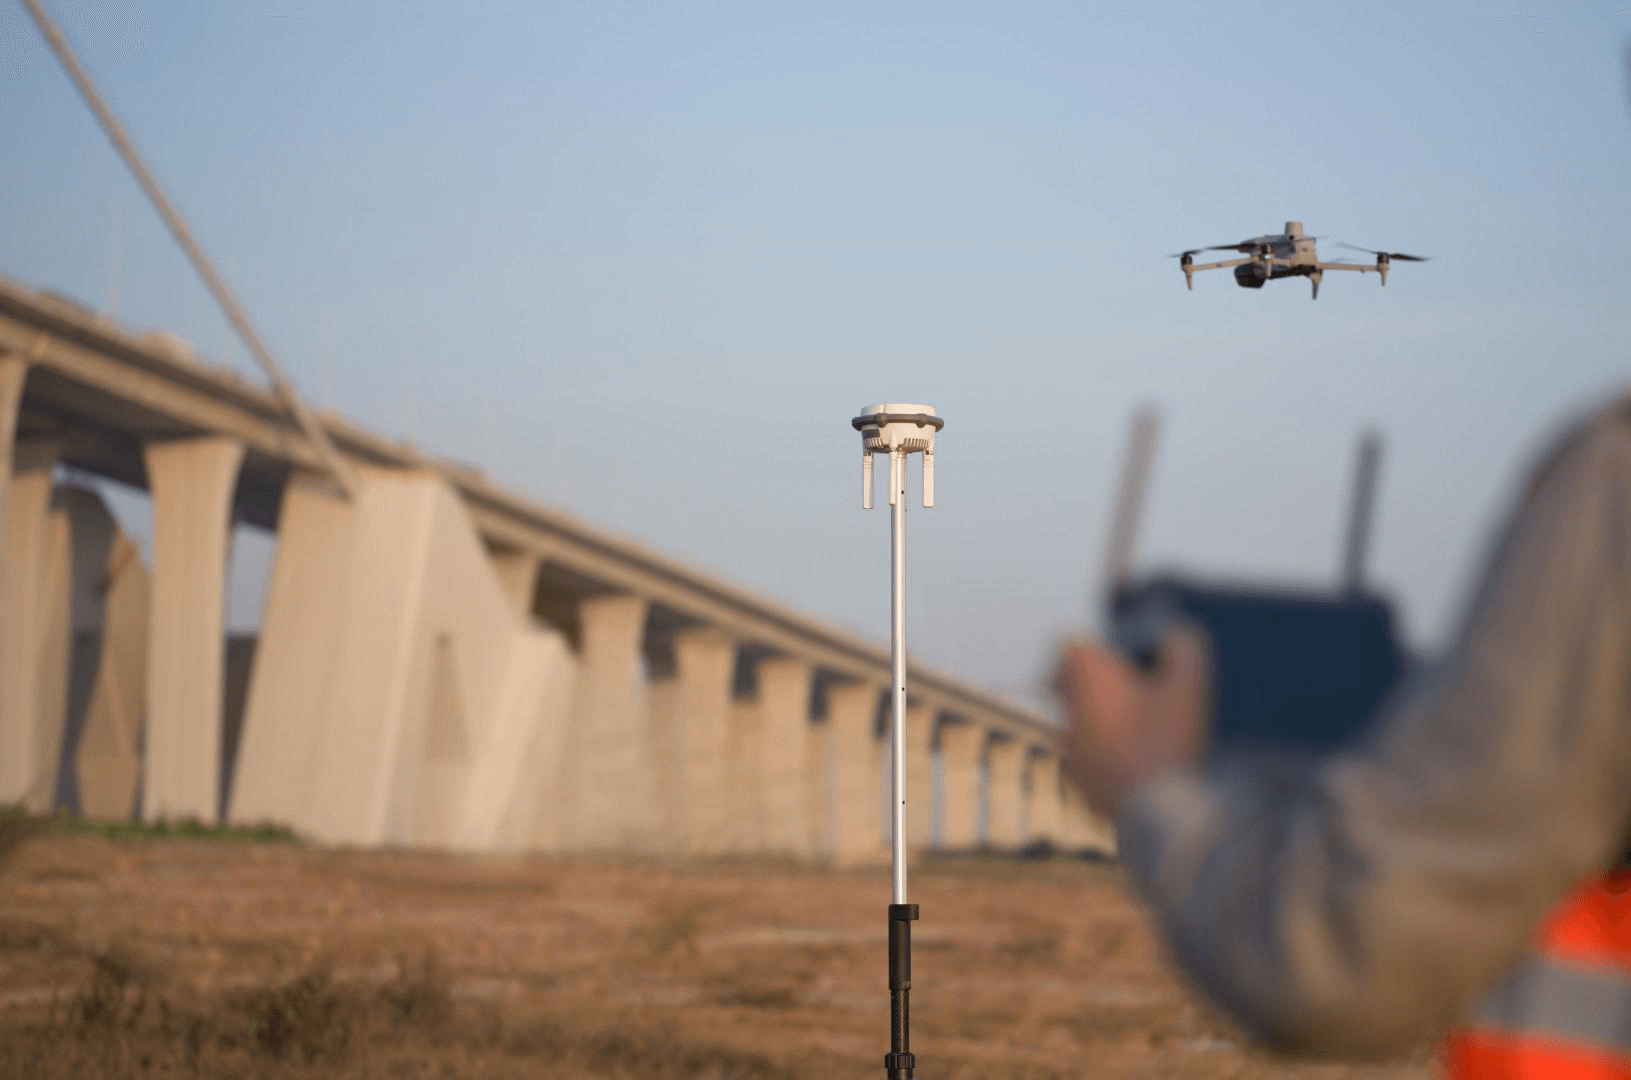
Drone LiDAR and Photogrammetry
Drone platforms capture the circuit from above, providing:
- Complete circuit layout in a single georeferenced dataset
- Surrounding infrastructure and spectator area documentation
- Elevation context that ties the track into the surrounding terrain
- High-resolution visual imagery for overlay on the 3D model
Survey Control Networks
A precisely measured control network ties all scan data together. Control points are established using GNSS observations and total station traverses, providing the common reference framework that links terrestrial and aerial datasets.
From Scan Data to Safety Analysis

The engineering value of circuit scan data extends well beyond visual documentation:
Surface Profiling
The 3D surface model reveals:
- Standing water risk: Low spots where water accumulates during rain, creating aquaplaning hazards
- Surface deterioration: Settling, cracking, and aggregate loss that affects grip levels
- Repaving quality: Post-construction verification that new asphalt meets the specified profile
Barrier Clearance Analysis
FIA regulations specify minimum distances between the racing line and barriers at every point on the circuit. The scan data allows automated measurement of these clearances, identifying:
- Areas where clearances are below minimum requirements
- Sections where barrier angles create deflection risks
- Points where run-off area geometry needs modification
Run-Off Area Assessment
Run-off areas must decelerate a car from racing speed before it reaches a barrier. The scan data enables:
- Deceleration distance calculations based on actual surface geometry
- Surface material transition mapping (asphalt → gravel → grass)
- Grade analysis to verify that run-off areas slope correctly for deceleration
Beyond F1: Applications for Any Racing Circuit
The scanning methodology used for F1 circuits is directly applicable to:
- NASCAR ovals: Banking angle verification, surface profiling, barrier documentation
- IndyCar circuits: Combined oval and road course configurations
- Road courses: IMSA, GT racing, and club-level circuits
- Karting tracks: Increasingly using drone LiDAR for track design and safety documentation
- Drag strips: Surface flatness verification and timing system calibration
Our motorsport circuit scanning services cover all circuit types and configurations, using the same equipment and methodology proven at the F1 level. For an educational deep-dive, explore our racing circuit scanning technology guide.
Frequently Asked Questions
How often are F1 circuits scanned? Most circuits are scanned annually as part of the FIA homologation process. Additional scans are performed after significant modifications, resurfacing, or safety incidents that may have altered barrier positions.
Can you scan a circuit while cars are on track? No. Scanning requires direct line-of-sight to the track surface, and personnel or equipment on track during sessions is prohibited. Scanning is done during non-session windows.
How long does it take to scan an F1 circuit? A complete circuit scan — terrestrial and aerial — typically requires 3-5 days of field work. Processing and deliverable preparation adds 4-8 weeks depending on the level of analysis required.
What accuracy does motorsport scanning achieve? Terrestrial laser scanning achieves ±2-5mm accuracy for track surfaces and barriers. Drone LiDAR achieves ±20-50mm for surrounding areas and site context.
Is the scanning data publicly available? No. Circuit scanning data is typically confidential, owned by the circuit operator or the FIA. The data shared with EA/Codemasters for game development is licensed under separate agreements.
Explore our motorsport circuit 3D scanning services and racing circuit scanning technology guide. For comparative methods, see our guide on photogrammetry vs LiDAR.
Ready to Start Your Project?
Get a free quote and consultation from our 3D scanning experts.
Get Your Free Quote