Golf course LiDAR mapping is one of the fastest-growing applications for drone survey technology. Course architects, superintendents, and owners are discovering that a single LiDAR drone flight can produce the topographic data, drainage analysis, and terrain models that previously required weeks of ground survey work.
This guide covers everything you need to know about commissioning a golf course LiDAR survey — the technology, deliverables, equipment, and practical considerations that determine project success.
Why Golf Courses Need LiDAR
Golf courses present a unique mapping challenge. They combine open terrain with dense tree canopy, water features with sand bunkers, and manicured turf with natural rough. The terrain undulations that define a great golf hole are measured in centimeters — subtle enough to be invisible to the eye but significant enough to determine how water drains, where turf diseases develop, and how the playing experience feels.
Traditional ground surveys capture these details, but slowly. A survey crew with total stations and GPS equipment might spend 2-3 weeks mapping a full 18-hole course. A LiDAR drone completes the same work in 1-2 days of flying.
Key Applications
- Drainage planning: LiDAR-derived Digital Terrain Models reveal every slope, depression, and water flow path across the course. This data identifies ponding areas, inefficient drainage patterns, and potential flooding risks before they cause damage.
- Course renovation design: Architects use LiDAR terrain data for fairway layout changes, bunker redesign, green reconstruction, and new hole development. The data provides the existing conditions baseline that design work builds on.
- Cut/fill volume calculations: Renovation projects that move earth need precise volume estimates. LiDAR data calculates cut and fill volumes to within 1-3% of actual moved material.
- Asset management: A complete 3D record of the course serves as the baseline for ongoing turf management, irrigation planning, and infrastructure maintenance.
- Course design verification: After construction, a comparison scan verifies that built conditions match the design intent.
LiDAR vs Photogrammetry for Golf Courses
Both LiDAR and photogrammetry produce 3D terrain data from drone platforms, but they work differently and produce different results. For golf courses, the distinction matters.
Photogrammetry (Zenmuse P1)
Photogrammetry uses overlapping photographs to reconstruct 3D geometry through software processing. It produces excellent visual products — orthomosaic maps, textured 3D models, and high-resolution imagery.
Advantage: Better visual products and texture detail. Limitation: Cannot penetrate vegetation. Photogrammetry sees the top of the tree canopy, not the ground beneath it. On a heavily treed course, 20-40% of the terrain may be hidden under canopy.
LiDAR (Zenmuse L3)
LiDAR fires laser pulses that penetrate gaps in vegetation canopy to reach the ground surface. Multiple returns per pulse mean that the same laser shot can register the top of a tree AND the ground beneath it.
Advantage: Sees through vegetation to the bare earth. Produces accurate Digital Terrain Models even under dense tree cover. Limitation: Does not produce the visual quality of photogrammetry. Point clouds are measurements, not photographs.
For Golf Courses: LiDAR Wins
Most golf course survey projects prioritize terrain accuracy over visual quality. The deliverables that drive decision-making — DTMs, contour maps, drainage analysis, volume calculations — all depend on bare-earth ground surface data. LiDAR delivers this data under tree canopy where photogrammetry cannot.
The ideal approach combines both: LiDAR for terrain accuracy and photogrammetry for visual documentation. The DJI Matrice 4E platform supports both the Zenmuse L3 (LiDAR) and Zenmuse P1 (photogrammetry) payloads, allowing both datasets to be collected in sequential flights.
What Gets Mapped
A comprehensive golf course LiDAR survey captures the entire course and surrounding property:
Fairways and Greens
The playing surfaces are mapped at centimeter resolution. Every contour, swale, and slope is captured. Green surface data supports drainage analysis and reconstruction planning. Fairway data supports mowing pattern optimization and irrigation layout.
Bunkers
Sand bunkers are captured in 3D, including lip heights, base depths, and drainage slopes. This data supports bunker renovation — one of the most common course improvement projects.
Water Features
Ponds, lakes, streams, and drainage channels are mapped at the water surface level. Shoreline geometry is captured precisely. Bathymetric data (below water surface) requires separate equipment, but the LiDAR data establishes the spatial context for water features.
Tree Canopy
LiDAR’s multiple-return capability captures both the canopy surface and the ground beneath. This produces two valuable datasets: a Digital Surface Model (DSM) showing everything including trees, and a Digital Terrain Model (DTM) showing only the bare earth. The difference between the two reveals canopy height and density.
Cart Paths and Infrastructure
Paved paths, bridges, buildings, maintenance facilities, and irrigation infrastructure are all captured. This comprehensive site documentation supports facility management and infrastructure improvement planning.
Property Boundaries and Context
The survey captures the full property extent, including perimeter vegetation, adjacent land use, and access points. This context data supports development planning, buffer zone analysis, and environmental documentation.
Deliverables
| Deliverable | Format | Use Case |
|---|---|---|
| Digital Terrain Model (DTM) | GeoTIFF, DWG | Bare-earth surface for drainage, design, grading |
| Digital Surface Model (DSM) | GeoTIFF | Complete surface including vegetation and structures |
| Contour maps | DWG, PDF | 1-ft or 0.5-ft interval contours for engineering |
| Orthomosaic | GeoTIFF | High-resolution visual map (from photogrammetry) |
| Point cloud | LAS, LAZ, E57 | Complete 3D dataset for engineering software |
| Cross-sections | DWG, PDF | Cut-lines through specific holes or features |
| Volume calculations | Report, DWG | Cut/fill estimates for earthwork projects |
| Drainage flow analysis | GeoTIFF, Report | Water flow paths, accumulation zones, watershed areas |
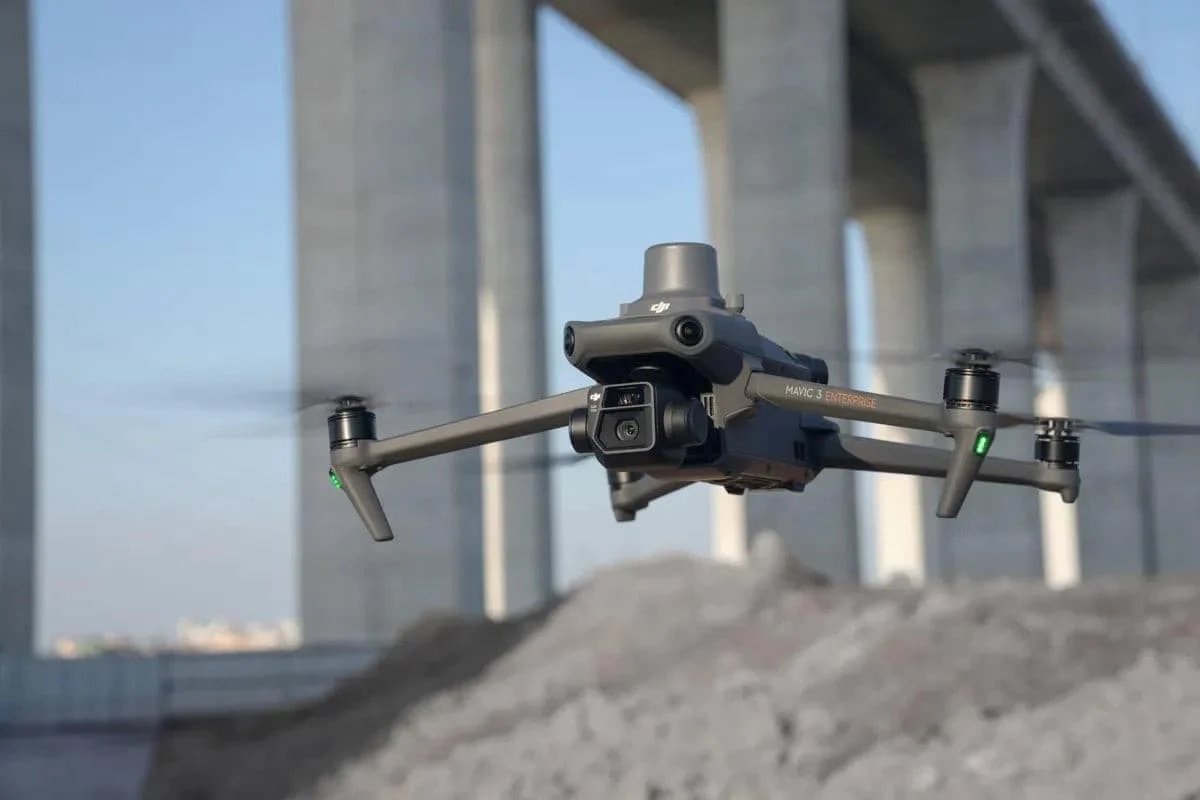
Equipment: DJI Matrice 4E + Zenmuse L3
The standard equipment configuration for golf course LiDAR surveys includes:
DJI Matrice 4E
Enterprise drone platform with 42-minute flight time, IP55 weather rating, and RTK positioning. The M4E carries either LiDAR or photogrammetry payloads on sequential flights.
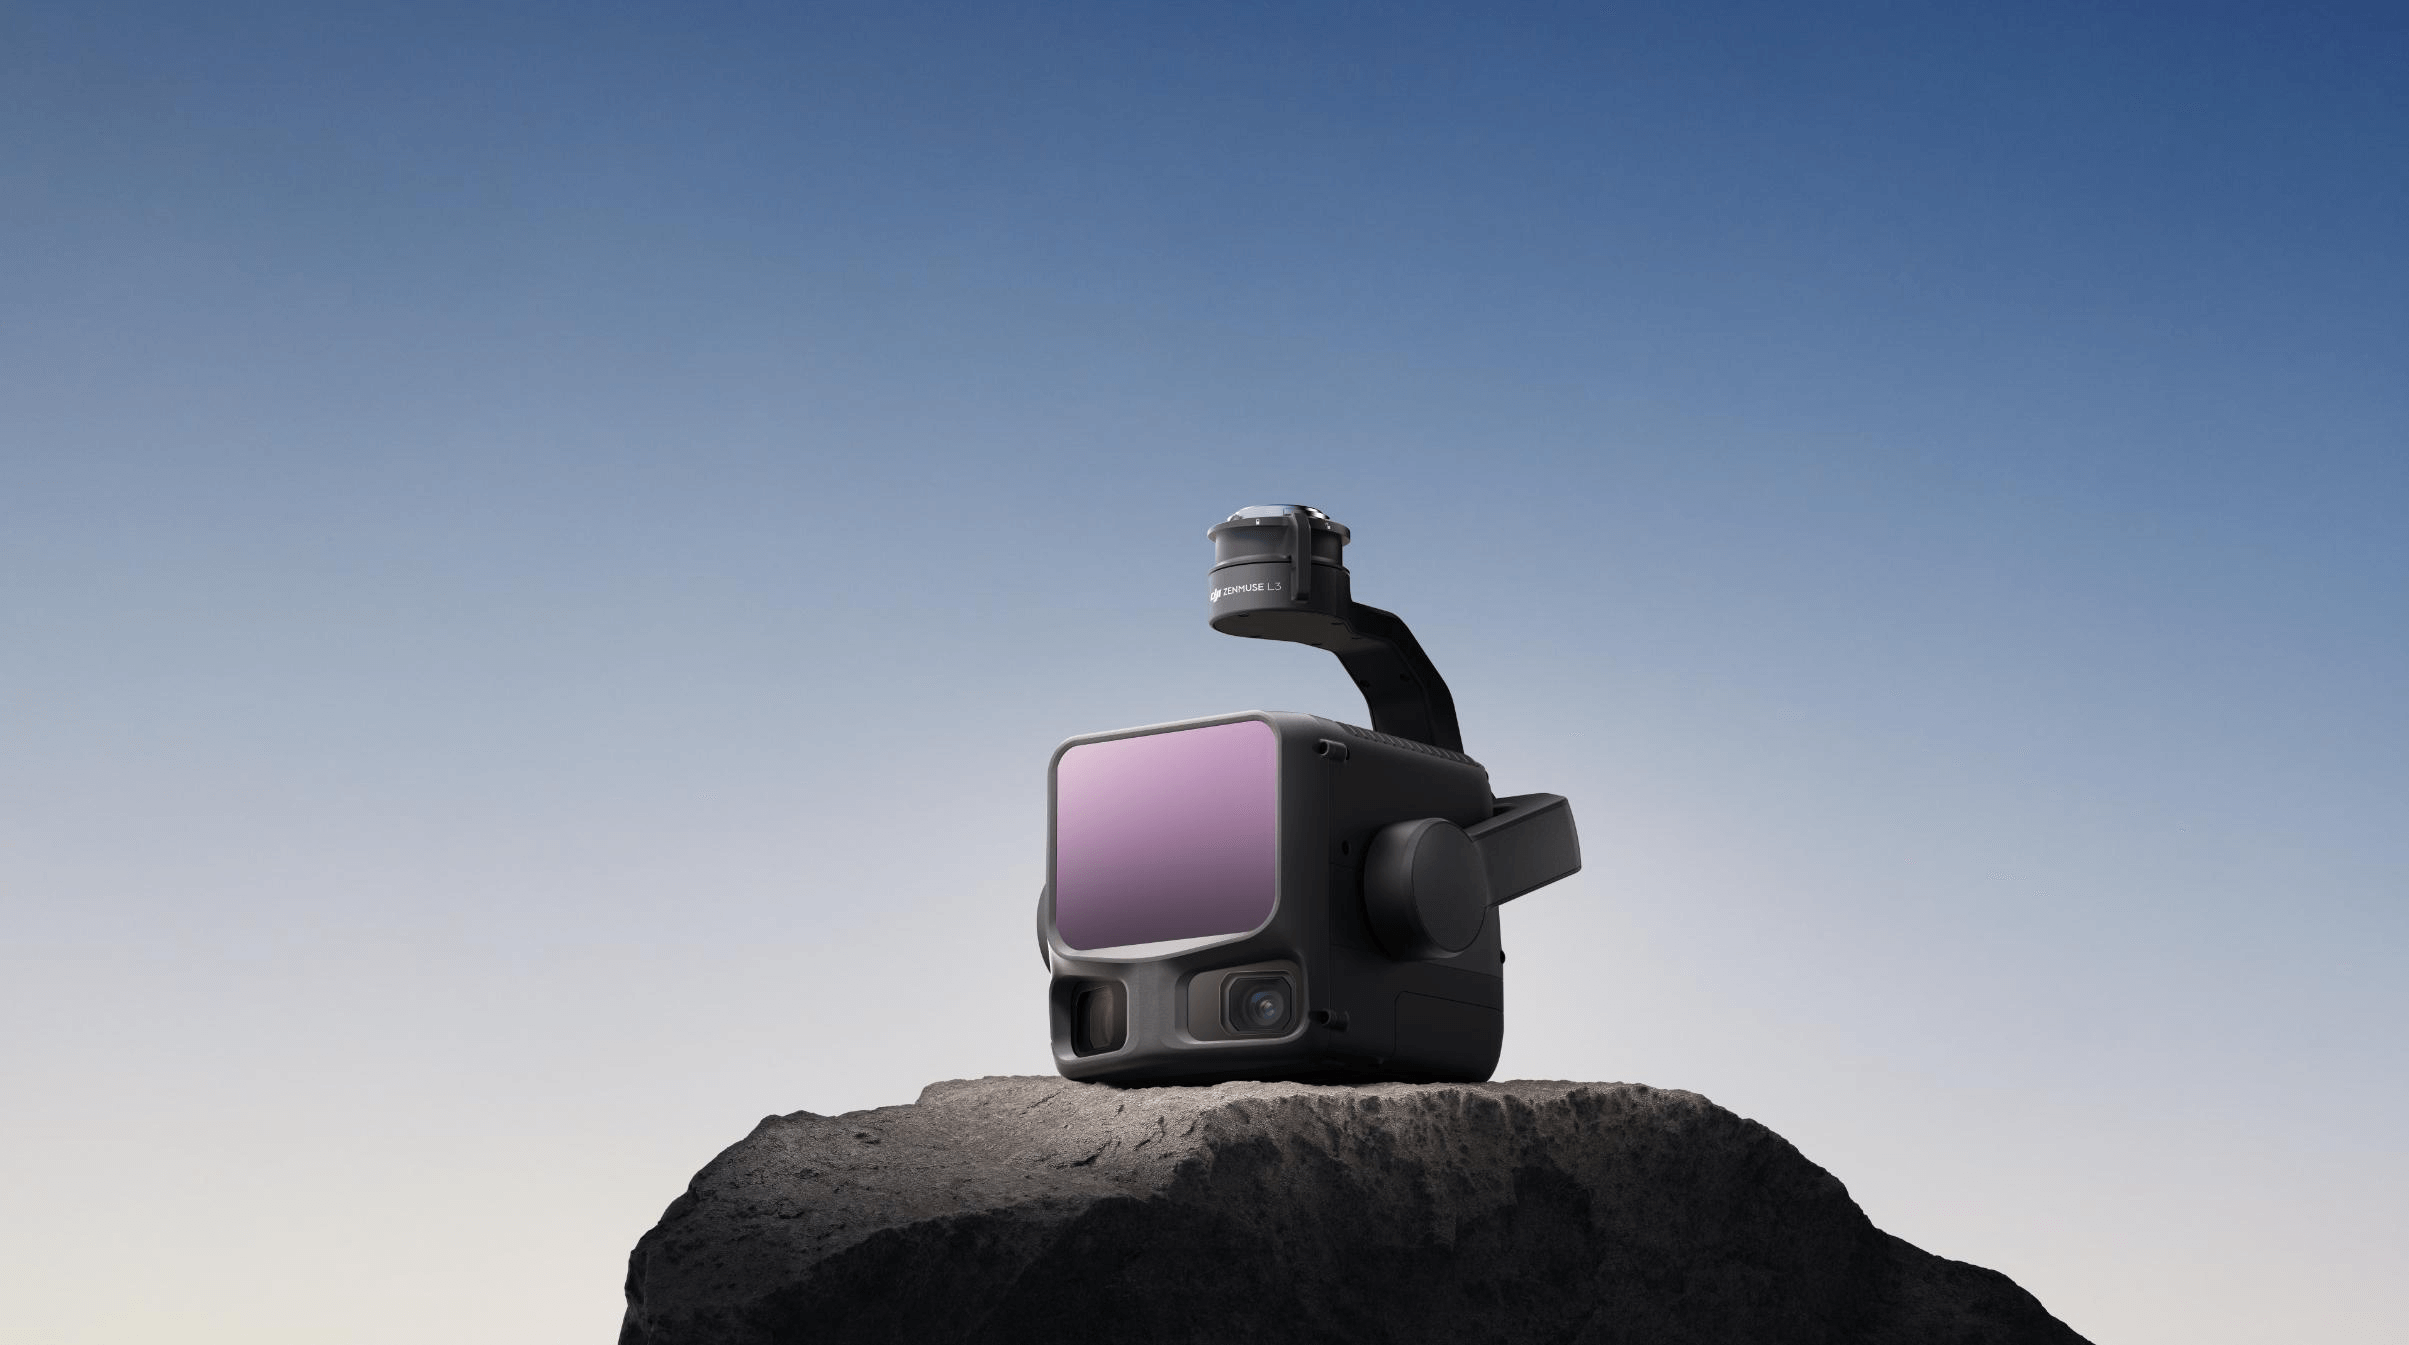
Zenmuse L3 (LiDAR)
- 5 returns per laser pulse (canopy penetration)
- 250m detection range
- ±8mm ranging accuracy
- 240,000 points per second
- Integrated IMU for precise positioning
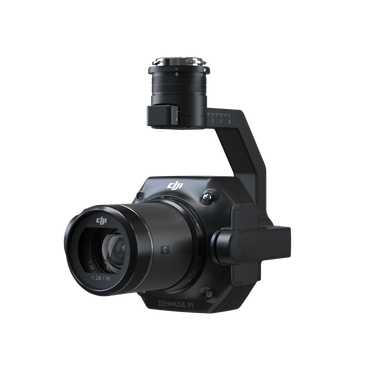
Zenmuse P1 (Photogrammetry)
- 45MP full-frame CMOS sensor
- Mechanical shutter (no rolling shutter distortion)
- 3 interchangeable lenses (24mm, 35mm, 50mm)
- Sub-centimeter accuracy with RTK
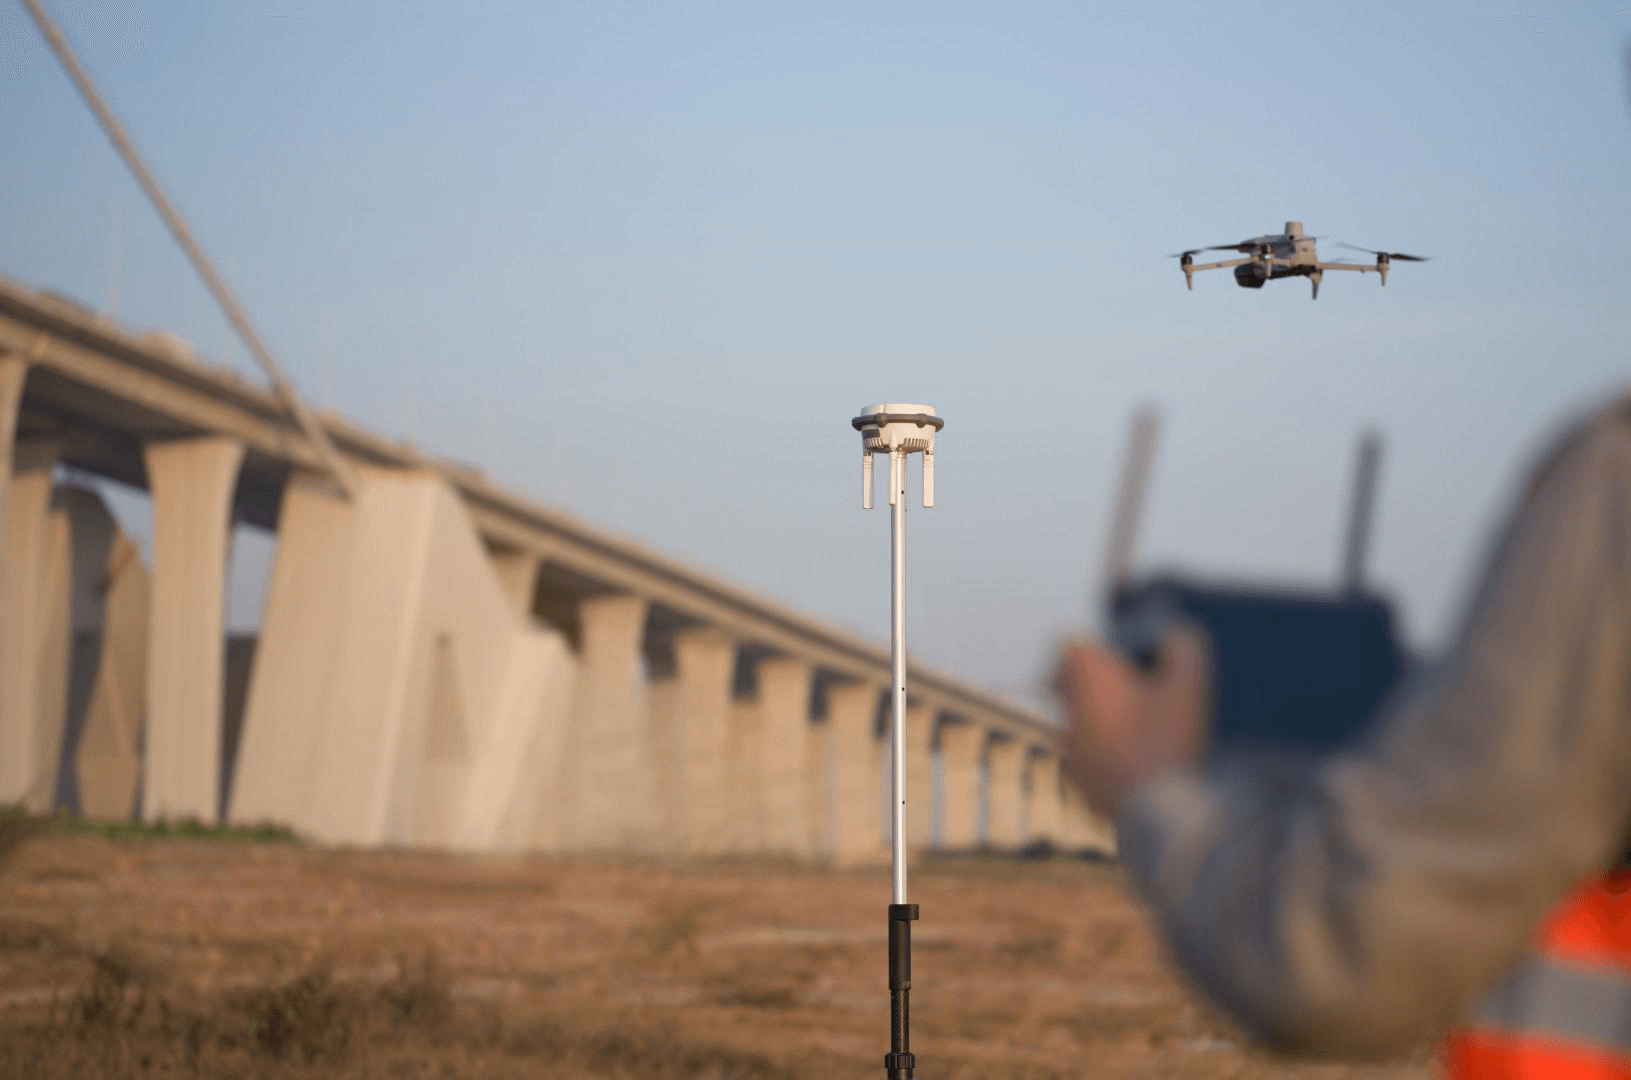
RTK/PPK Positioning
Real-time kinematic or post-processed kinematic corrections deliver centimeter-accurate positioning for survey-grade deliverables. This ensures that the terrain model is georeferenced to real-world coordinates with sufficient accuracy for engineering use.
Flight Planning for Golf Course Surveys
A typical 18-hole golf course covers 100-200 acres (40-80 hectares). At standard LiDAR survey parameters (80m flight altitude, 60% overlap), this requires:
- LiDAR flights: 45-90 minutes of total flight time across 2-4 battery changes
- Photogrammetry flights (if included): Similar total flight time with different overlap patterns
- Ground control setup: 4-8 ground control points distributed across the course, surveyed with GNSS
- Total field time: 1 full day for a standard 18-hole course
For 36-hole facilities or courses over 200 acres, plan for 2 days of field work.
Flight Parameters
| Parameter | LiDAR Survey | Photogrammetry Survey |
|---|---|---|
| Altitude (AGL) | 60-100m | 80-120m |
| Speed | 8-12 m/s | 6-10 m/s |
| Overlap | 30-50% sidelap | 80% forward, 70% side |
| Point density | 100-300 pts/m² | N/A |
| Ground sample distance | N/A | 1-3 cm/pixel |
How to Commission a Golf Course Survey
Step 1: Define the Purpose
The project purpose determines the required accuracy, deliverables, and scope:
- Drainage analysis → LiDAR DTM at 0.5-ft contour intervals minimum
- Renovation design → Combined LiDAR + photogrammetry for terrain + visual
- Asset inventory → Photogrammetry orthomosaic + LiDAR for infrastructure
- Volume calculations → LiDAR DTM with survey-grade accuracy
Step 2: Specify the Scope
Define which areas need surveying. Full 18-hole coverage is standard, but some projects focus on specific holes, the practice facility, or renovation zones.
Step 3: Check Airspace
Golf courses near airports may require FAA coordination. Your survey provider handles this, but it can add 2-4 weeks to the timeline if a waiver is required.
Step 4: Plan the Timing
- Fall/winter (dormant season): Best for terrain surveys under deciduous tree canopy — leaves are off, LiDAR penetrates more effectively
- Spring/summer: Best for turf condition assessment and visual documentation
- Avoid: Active tournament weeks, heavy rain periods, high wind days
Step 5: Request a Quote
Provide your survey provider with: course acreage, number of holes, intended use for the data, desired deliverables, and timeline. Use our niche project cost estimator for an initial budget range.
Frequently Asked Questions
How much does a golf course LiDAR survey cost? A standard 18-hole LiDAR survey typically costs $5,000-$15,000 depending on course size, deliverables, and whether photogrammetry is included. Combined LiDAR + photogrammetry surveys with full engineering deliverables range $10,000-$20,000. See our cost estimator for budget guidance.
How long does a golf course drone survey take? Field work takes 1-2 days for most 18-hole courses. Data processing and deliverable preparation adds 2-4 weeks. Total project from field start to final deliverables is typically 3-5 weeks. Read our detailed timeline answer.
What is the accuracy of golf course LiDAR? With RTK/PPK positioning, LiDAR DTMs achieve ±3-5cm vertical accuracy on open terrain and ±5-10cm under moderate canopy. This exceeds the accuracy requirements for drainage analysis, renovation design, and volume calculations.
Can LiDAR see through trees on a golf course? Yes. LiDAR’s multiple-return capability means laser pulses penetrate gaps in canopy to reach the ground. Under moderate deciduous canopy, ground surface coverage is typically 60-80%. Under dense evergreen canopy, coverage may be 30-50%. Winter surveys under deciduous canopy achieve the best ground penetration.
What is the difference between DTM and DSM? A Digital Terrain Model (DTM) shows only the bare earth surface — vegetation and structures are removed. A Digital Surface Model (DSM) shows everything, including tree canopy and buildings. Both are produced from the same LiDAR flight. The DTM is used for drainage and grading; the DSM is used for canopy analysis and visual context.
Explore our golf course LiDAR mapping services or read our golf course survey technology guide. Have questions? See what is golf course LiDAR mapping or request a quote.
Ready to Start Your Project?
Get a free quote and consultation from our 3D scanning experts.
Get Your Free Quote