A drone aerial survey of a golf course typically costs $5,000-$15,000. For courses that use the data to optimize irrigation, the documented return on investment is measured in six figures annually. Birds Eye Aerial Drones documented $160,000 per year in water cost savings for a course that used aerial survey data to redesign its irrigation patterns, plus an additional $50,000 saved by avoiding unnecessary resodding.
These are not hypothetical projections. They are documented operational savings from courses that used drone-collected terrain data to make measurable improvements in water management.
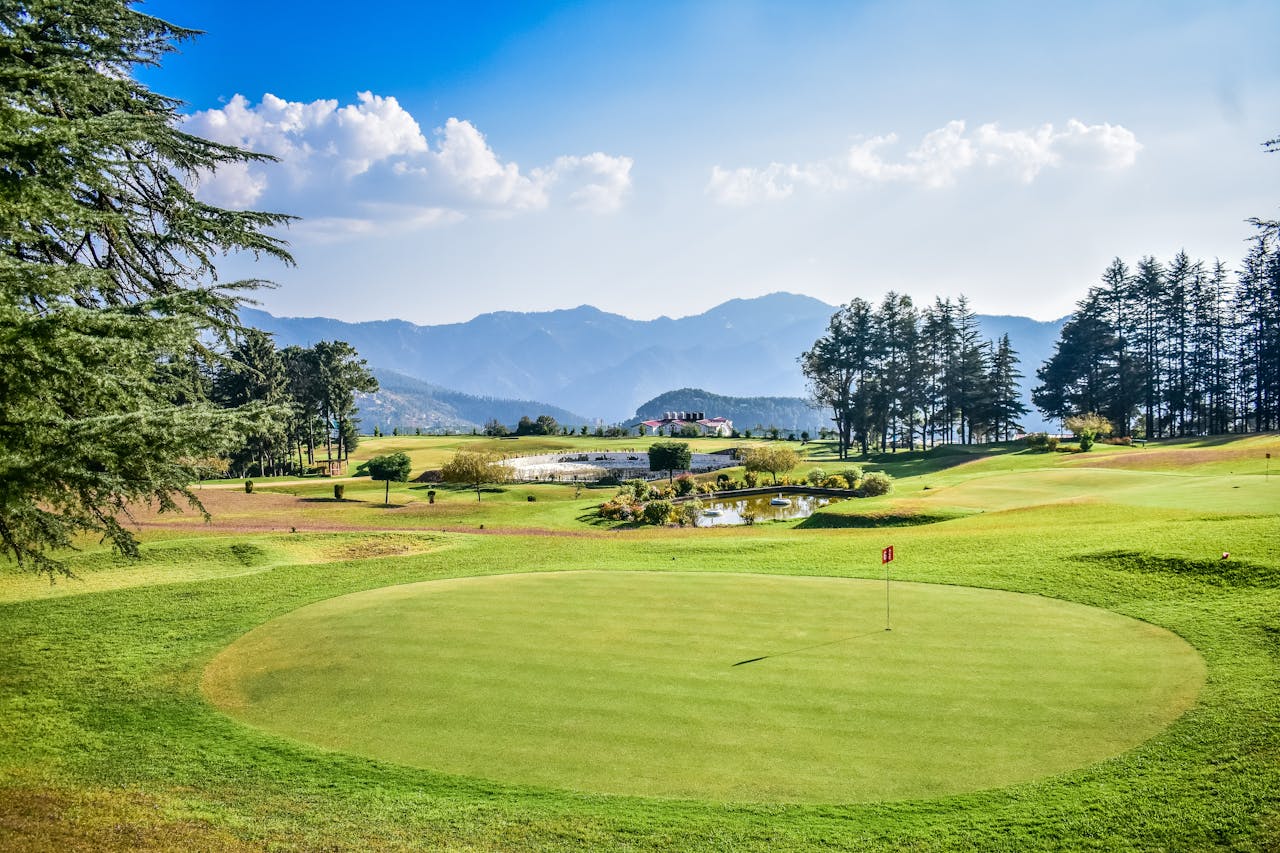
The $160K Water Cost Problem
Water is the single largest variable operating cost for most golf courses. Courses in warm climates may use 100,000-300,000+ gallons per day during peak season. At current utility rates, annual water costs for irrigation alone can reach $200,000-$500,000+ depending on course size, climate zone, and local water pricing.
The problem is not that courses use too much water in general — the problem is that they apply water uniformly when the terrain demands variable application. Flat areas, slopes, depressions, and elevated sections all have different drainage characteristics, different moisture retention, and different irrigation needs.
Where Water Gets Wasted
Without precise terrain data, irrigation systems typically apply water based on simple zone maps that treat large areas as uniform. The reality is more complex:
- Slopes shed water: Sloped areas drain faster and need more frequent but lighter irrigation cycles. Applying the same volume as flat areas means much of the water runs off before it reaches root depth.
- Depressions trap water: Low spots accumulate water from surrounding terrain. They often receive irrigation they do not need because the zone schedule treats them the same as adjacent areas.
- Soil variation: Even small changes in soil composition affect water retention. Sandy areas drain quickly; clay areas retain moisture longer. Uniform irrigation wastes water on areas that retain moisture naturally.
- Canopy shade patterns: Areas under tree canopy require less irrigation due to reduced evapotranspiration. Without data on canopy coverage, irrigation schedules overwater shaded areas.
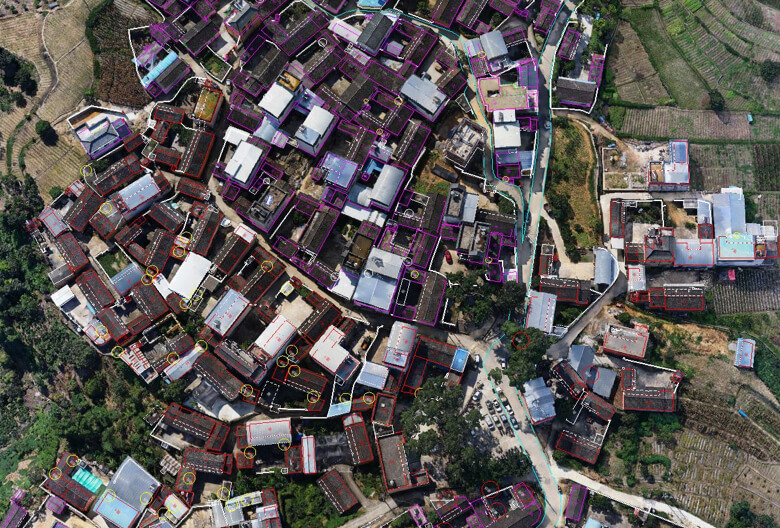
A drone LiDAR survey reveals all of these factors simultaneously. The Digital Terrain Model shows every slope, depression, and drainage path at centimeter resolution. When this data is used to redesign irrigation zone maps, the savings are immediate and sustained.
How Aerial Data Reveals Water Waste
The core of the analysis is the Digital Terrain Model (DTM) — a bare-earth surface model derived from LiDAR that captures every micro-contour across the course.
Slope Analysis
The DTM is processed to generate slope maps that classify every square meter of the course by gradient. This reveals:
- Areas where slope exceeds the recommended maximum for effective irrigation (typically 8-12% for turf)
- Transition zones where flat areas meet slopes (where water accumulates and causes ponding)
- Drainage corridors where surface water naturally flows across the course
Flow Accumulation Mapping
Using the DTM and hydrology modeling tools, the survey data produces flow accumulation maps that show where water collects during rainfall or irrigation. These maps identify:
- Natural drainage paths that carry water across fairways
- Ponding zones where water pools due to terrain depressions
- Overflow points where water leaves the course property
Irrigation Zone Optimization
When the slope analysis and flow accumulation data are combined with the existing irrigation system layout, the result is a prescription map that shows exactly where the current system over-irrigates and under-irrigates.
Courses that have implemented zone optimization based on drone survey data report:
- 15-30% reduction in total water consumption
- Significant reduction in irrigation-related turf disease (caused by overwatering)
- More uniform turf quality across the course
Beyond Water: $50K Resodding Avoidance
The $50,000 resodding savings documented by Birds Eye Aerial Drones came from a separate but related benefit of aerial survey data: early detection of turf stress.
How Turf Damage Escalates
Turf problems visible to the naked eye are already severe. By the time a superintendent notices yellowing or thinning, the root system has been compromised for weeks. Root zone damage from overwatering, poor drainage, or soil compaction often requires full sod replacement — which costs $1.00-$3.00+ per square foot including material, labor, and establishment care.
A single large area of sod replacement can cost $10,000-$30,000. Multiple problem areas in a bad season can push total resodding costs to $50,000-$100,000+.
How Aerial Data Prevents Damage
Regular drone surveys (monthly or quarterly) produce multispectral imagery that detects turf stress before it becomes visible. Vegetation indices like NDVI (Normalized Difference Vegetation Index) quantify plant health across every square meter of the course.
When combined with the terrain data from LiDAR:
- Drainage problems are identified before turf damage occurs: The DTM shows where water accumulates; the NDVI shows where turf stress is developing. The correlation identifies drainage-related problems early.
- Soil compaction zones are mapped: Areas where vehicle traffic, foot traffic, or heavy equipment has compacted the soil show distinct stress patterns in multispectral imagery. These areas need aeration, not irrigation.
- Disease vectors are tracked: Many turf diseases spread along drainage corridors. The terrain data predicts where disease will move, allowing targeted treatment instead of blanket application.
DTM-Based Drainage Analysis
The most technically valuable deliverable from a golf course LiDAR survey is the drainage analysis derived from the DTM. This analysis answers the question that every superintendent needs answered: “Where does the water go?”
What the Analysis Reveals
-
Primary flow paths: The major drainage corridors that carry water across the course during rain events. These paths are often not where you expect — subtle terrain features redirect water in ways that are invisible at ground level.
-
Micro-depressions: Small terrain depressions (sometimes as shallow as 5-10cm) that trap water and create wet spots. These are the areas most likely to develop turf disease from standing water.
-
Watershed boundaries: Lines that divide the course into drainage zones. Each watershed drains to a specific low point. Understanding these boundaries allows targeted drainage improvements in the areas that will have the greatest impact.
-
Discharge points: Where surface water leaves the course property. Regulatory requirements often require documentation of discharge volumes and quality.
Drainage Improvement Prioritization
With the complete drainage model, superintendents and drainage engineers can prioritize improvement projects based on actual impact:
- Which depressions cause the most turf damage? (Fix these first)
- Which flow paths carry water across the highest-value playing surfaces? (Intercept these)
- Which existing drain lines are undersized or mislocated? (Upgrade or relocate)
This data-driven approach replaces the traditional method of “dig where it looks wet” with a comprehensive understanding of the entire course drainage system.
ROI Calculation for Your Course
The financial case for a golf course drone survey is straightforward:
| Item | Cost / Savings | Notes |
|---|---|---|
| LiDAR drone survey | -$8,000 to -$15,000 | One-time cost (full 18-hole survey) |
| Water savings (Year 1) | +$30,000 to +$80,000 | 15-30% reduction in irrigation costs |
| Resodding avoidance (Year 1) | +$10,000 to +$30,000 | Early detection of turf stress |
| Drainage improvement ROI | +$20,000 to +$50,000 | Targeted vs. reactive drainage work |
| Net Year 1 ROI | +$50,000 to +$145,000 | After survey cost |
The $160,000 annual savings figure represents a high-performing implementation where the course used the data comprehensively — irrigation optimization, turf monitoring, and drainage improvement. Not every course will achieve these exact numbers, but the directional ROI is consistent across documented cases.
When the ROI Is Highest
The financial return is greatest for:
- Courses in high water-cost regions (California, Southwest US, Middle East)
- Older courses where irrigation systems were designed without terrain data
- Courses experiencing chronic drainage problems
- Facilities planning renovation or expansion (the survey data serves double duty)
How to Get Started
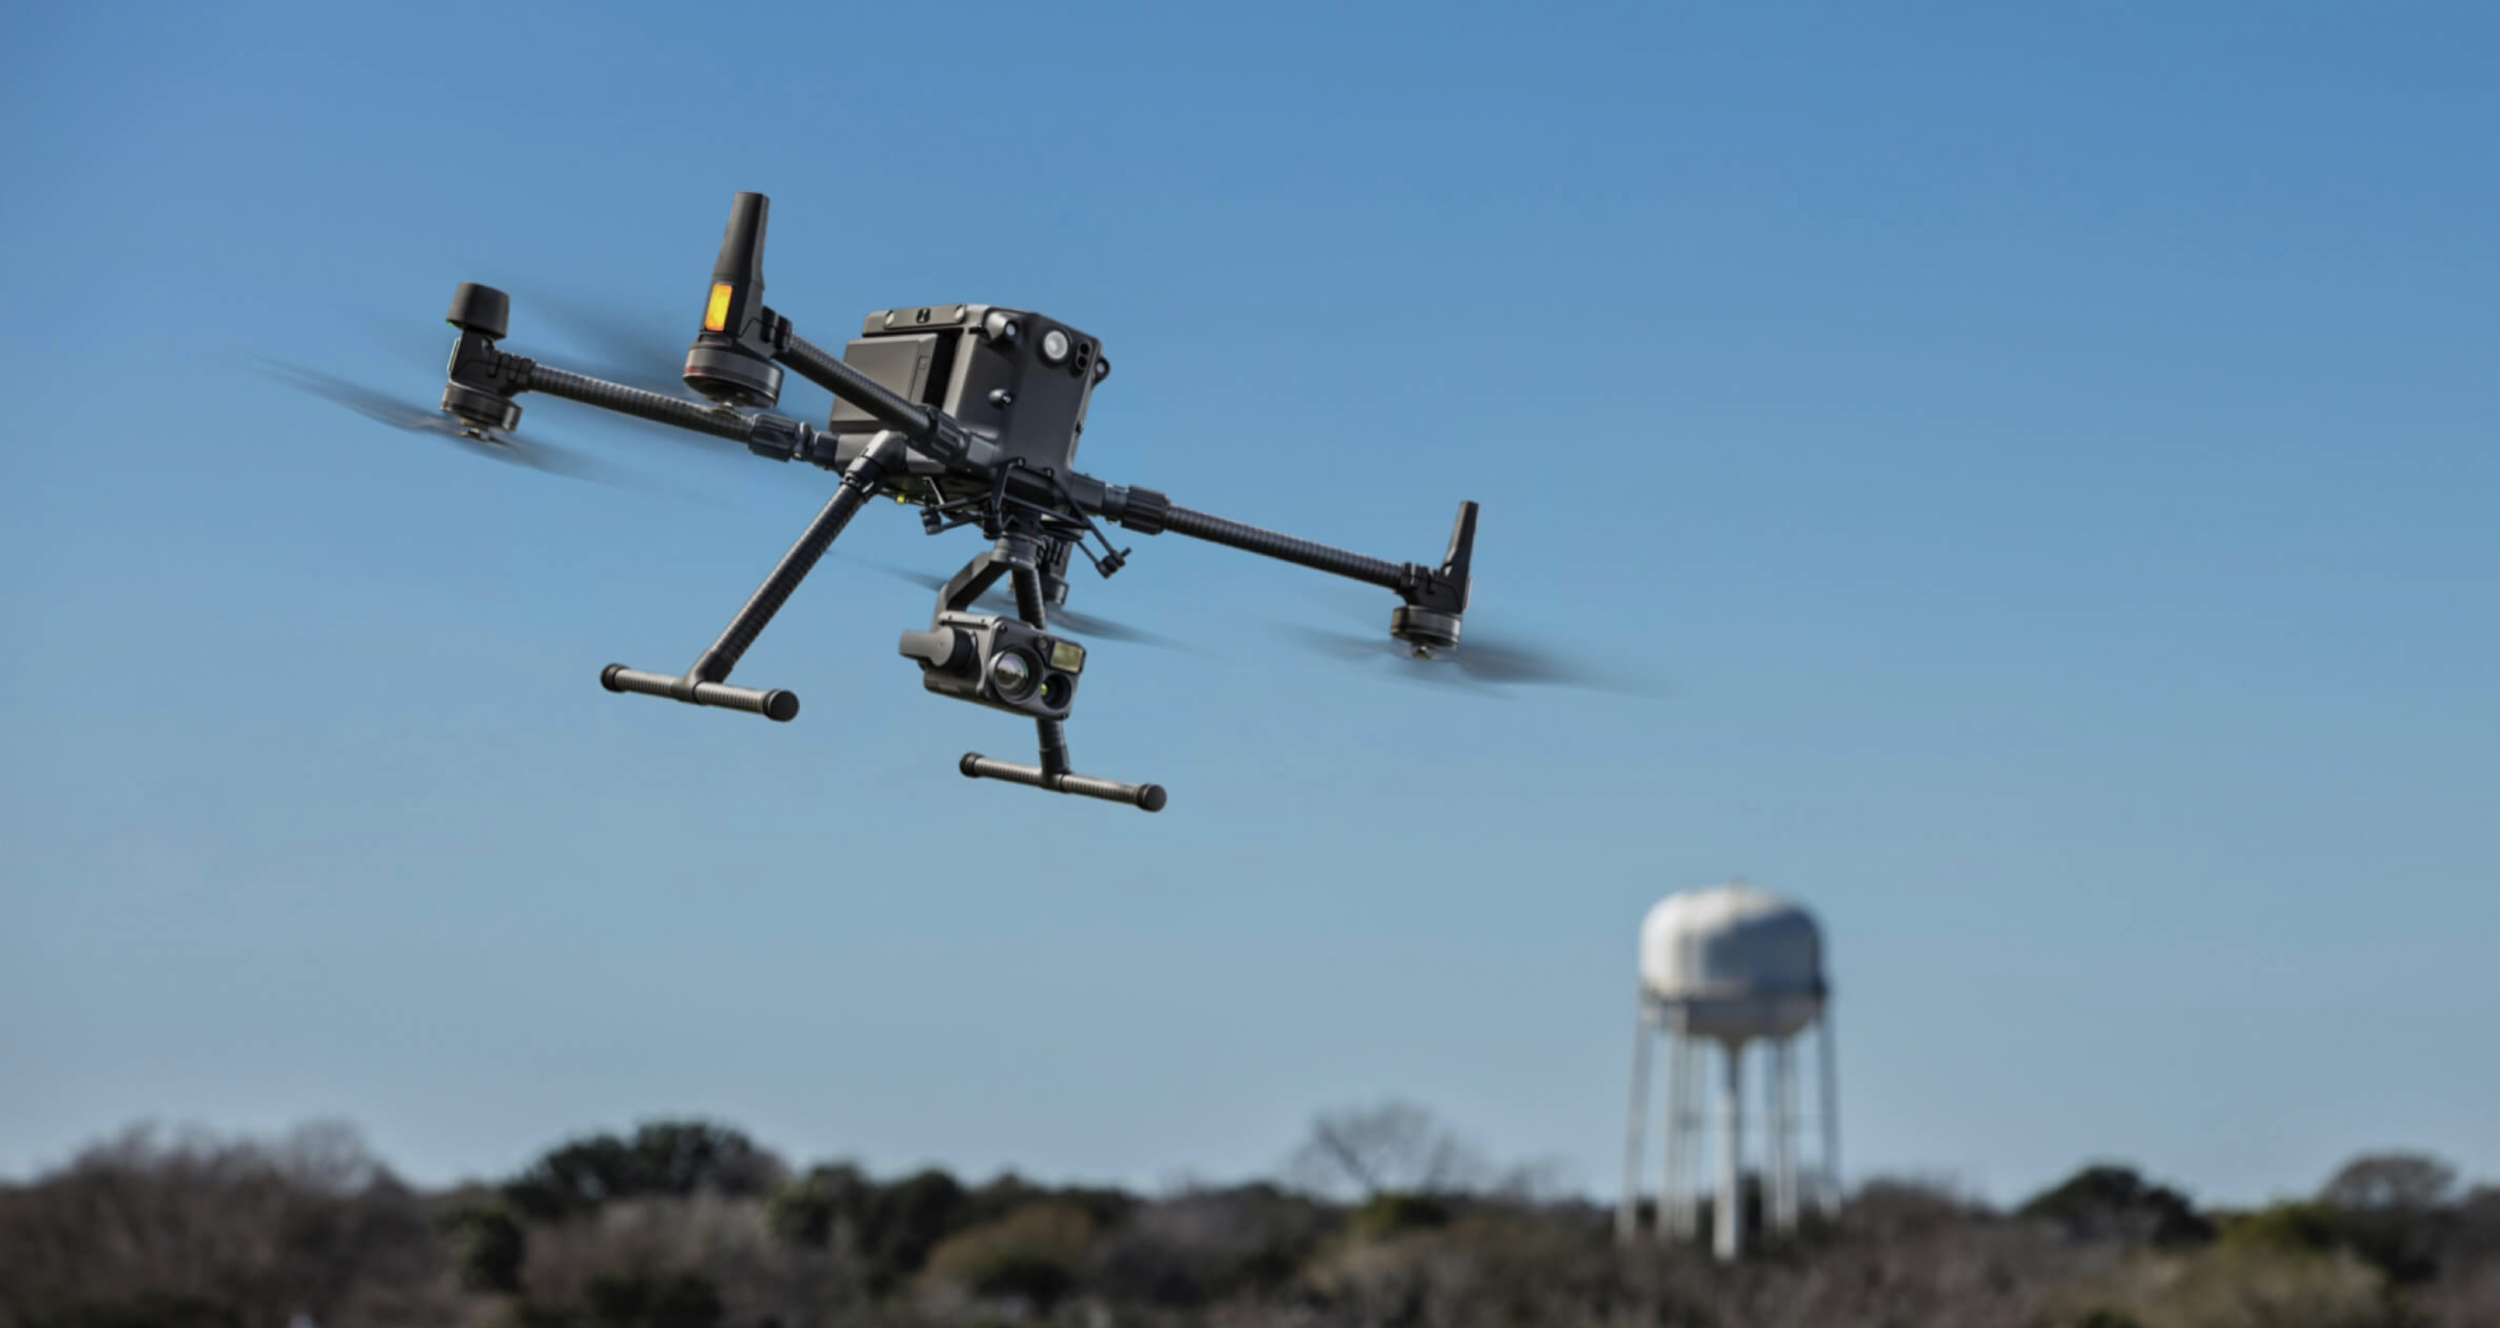
- Commission a LiDAR survey: Start with a full-course LiDAR flight to produce the DTM, slope analysis, and drainage model. Consider adding photogrammetry for visual documentation.
- Analyze drainage patterns: Work with your irrigation consultant or superintendent to overlay the DTM analysis on your current irrigation zone map.
- Identify quick wins: Zone optimization often produces measurable savings within the first month of implementation.
- Plan drainage improvements: Use the drainage model to prioritize capital improvement projects.
- Establish baseline: The initial survey becomes your ongoing reference for monitoring changes over time.
Use our niche project cost estimator for initial budget guidance, or request a quote for your specific course.
Frequently Asked Questions
How quickly do golf course drone survey savings appear? Water savings begin immediately after irrigation zone optimization is implemented — often within the first billing cycle. Resodding savings accumulate over the season as early stress detection prevents escalation.
How often should a golf course be surveyed? A comprehensive LiDAR terrain survey every 3-5 years is sufficient for drainage and terrain data (the ground surface changes slowly). Multispectral turf health monitoring benefits from monthly or quarterly flights during the growing season.
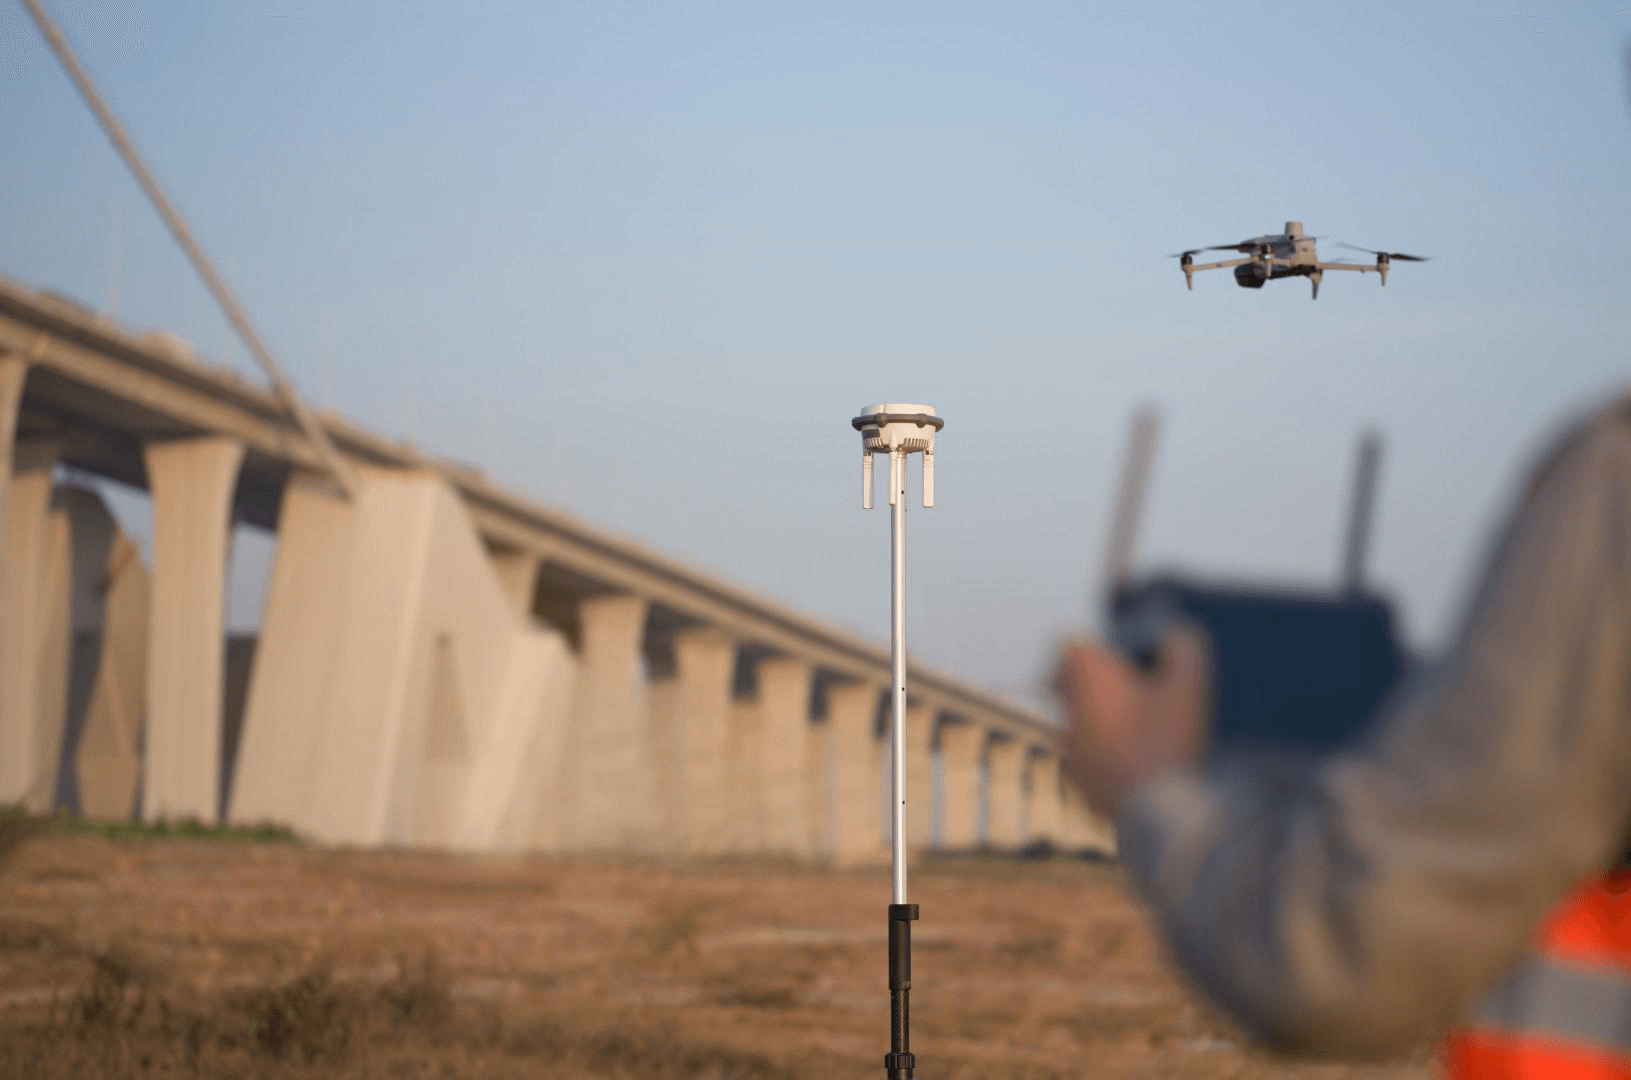
Does the survey disrupt course operations? Minimal disruption. Drone flights operate at 60-100m altitude and cover the course in 1-2 hours of total flying time. Ground control point setup takes 2-3 hours. Play can continue during the survey with minor coordination.
What if our course already has good drainage? Even well-drained courses benefit from the irrigation optimization data. Water savings from zone optimization are independent of drainage quality. The DTM also serves as an invaluable design reference for future renovation projects.
Learn more about golf course LiDAR mapping services or explore the underlying survey technology. For a full overview, read our complete golf course mapping guide.
Ready to Start Your Project?
Get a free quote and consultation from our 3D scanning experts.
Get Your Free Quote