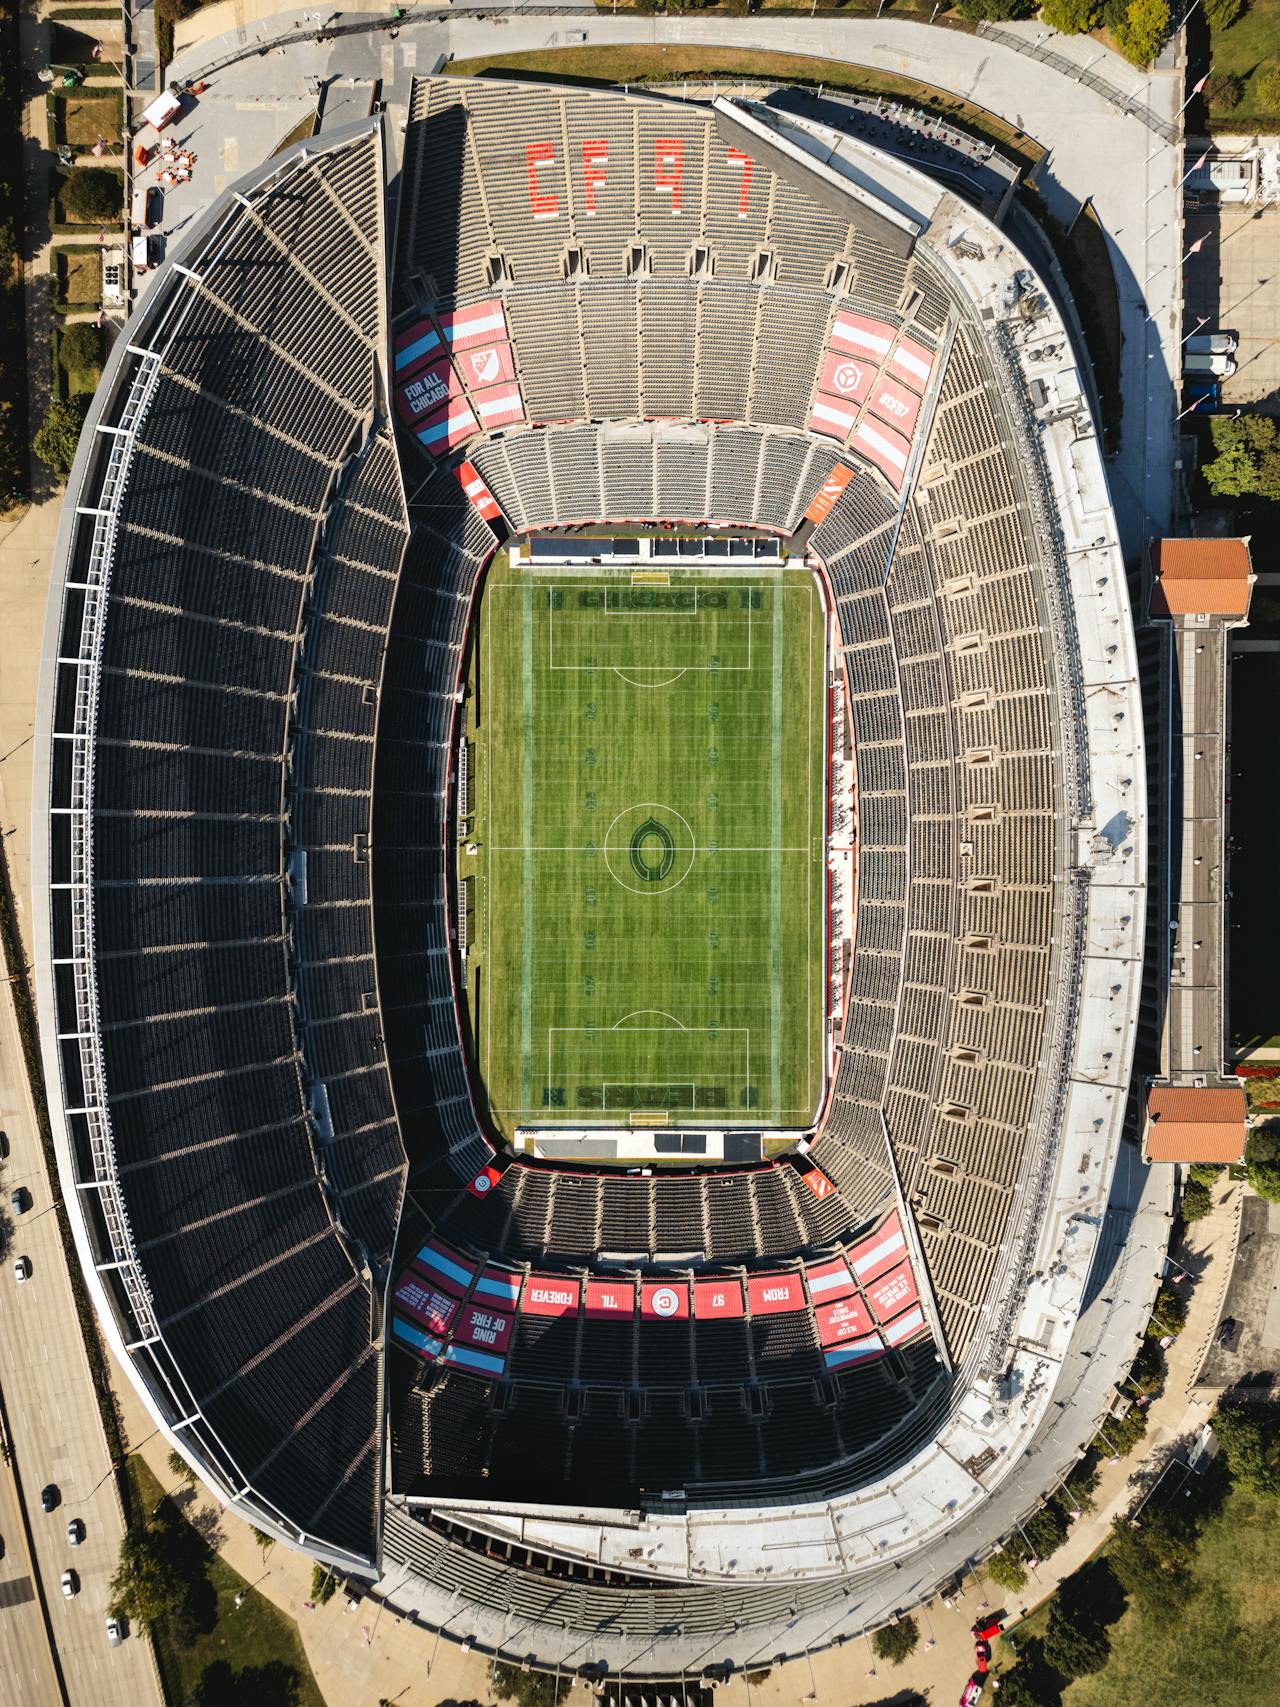
When Survey Hub completed the 3D scanning of Elland Road — the home of Leeds United — the project required 5,250 individual scan positions across the stadium’s interiors and exteriors. That number is not an outlier. It reflects the real-world complexity of capturing a major sports venue to the level of detail required for renovation planning and facility management.
This article examines what the Elland Road project reveals about stadium scanning methodology, technology requirements, and the operational considerations that determine project success.
Project Scope: 5,250 Scan Positions
The Elland Road project captured the complete stadium facility using a combination of terrestrial laser scanners, mobile mapping systems, and drone-based platforms. The 5,250 scan position count included:
- Seating bowl scans: Multiple scanner positions per section to capture the bowl geometry from different angles, including upper and lower tiers, corners, and the area behind each goal
- Concourse and circulation: Every concourse level, stairwell, ramp, and corridor
- Suites and hospitality areas: Premium seating sections, corporate boxes, and hospitality lounges
- Back-of-house: Locker rooms, media facilities, operations rooms, storage areas, and loading docks
- Mechanical and electrical spaces: Plant rooms, switch rooms, generator areas, and utility corridors
- Exterior and site: Building facades, roof structure, surrounding roads, and parking areas
To put that in perspective, a typical commercial office building of 50,000 square feet might require 200-400 scan positions. A major stadium with multiple concourse levels, complex geometry, and extensive back-of-house areas requires 10-25 times that number.
Technology Stack
The Elland Road project used a multi-sensor approach that combined three distinct scanning technologies, each suited to different areas of the stadium.
RIEGL VZ-600i — Long-Range Terrestrial Scanning
The RIEGL VZ-600i served as the primary scanner for the project. This long-range terrestrial laser scanner captures data at distances up to 600 meters with millimeter-level accuracy, making it suitable for the large open volumes of the seating bowl and exterior facades.
Key advantages for stadium work:
- Long-range capability: Captures the full bowl geometry from the pitch level without needing positions in every seating section
- High-speed acquisition: Up to 1.2 million measurements per second
- Eye-safe laser: Class 1 laser allows scanning in areas where staff or the public may be present
- Waveform digitization: Full waveform analysis for precise measurements on complex surfaces like mesh fencing, railings, and cable arrays
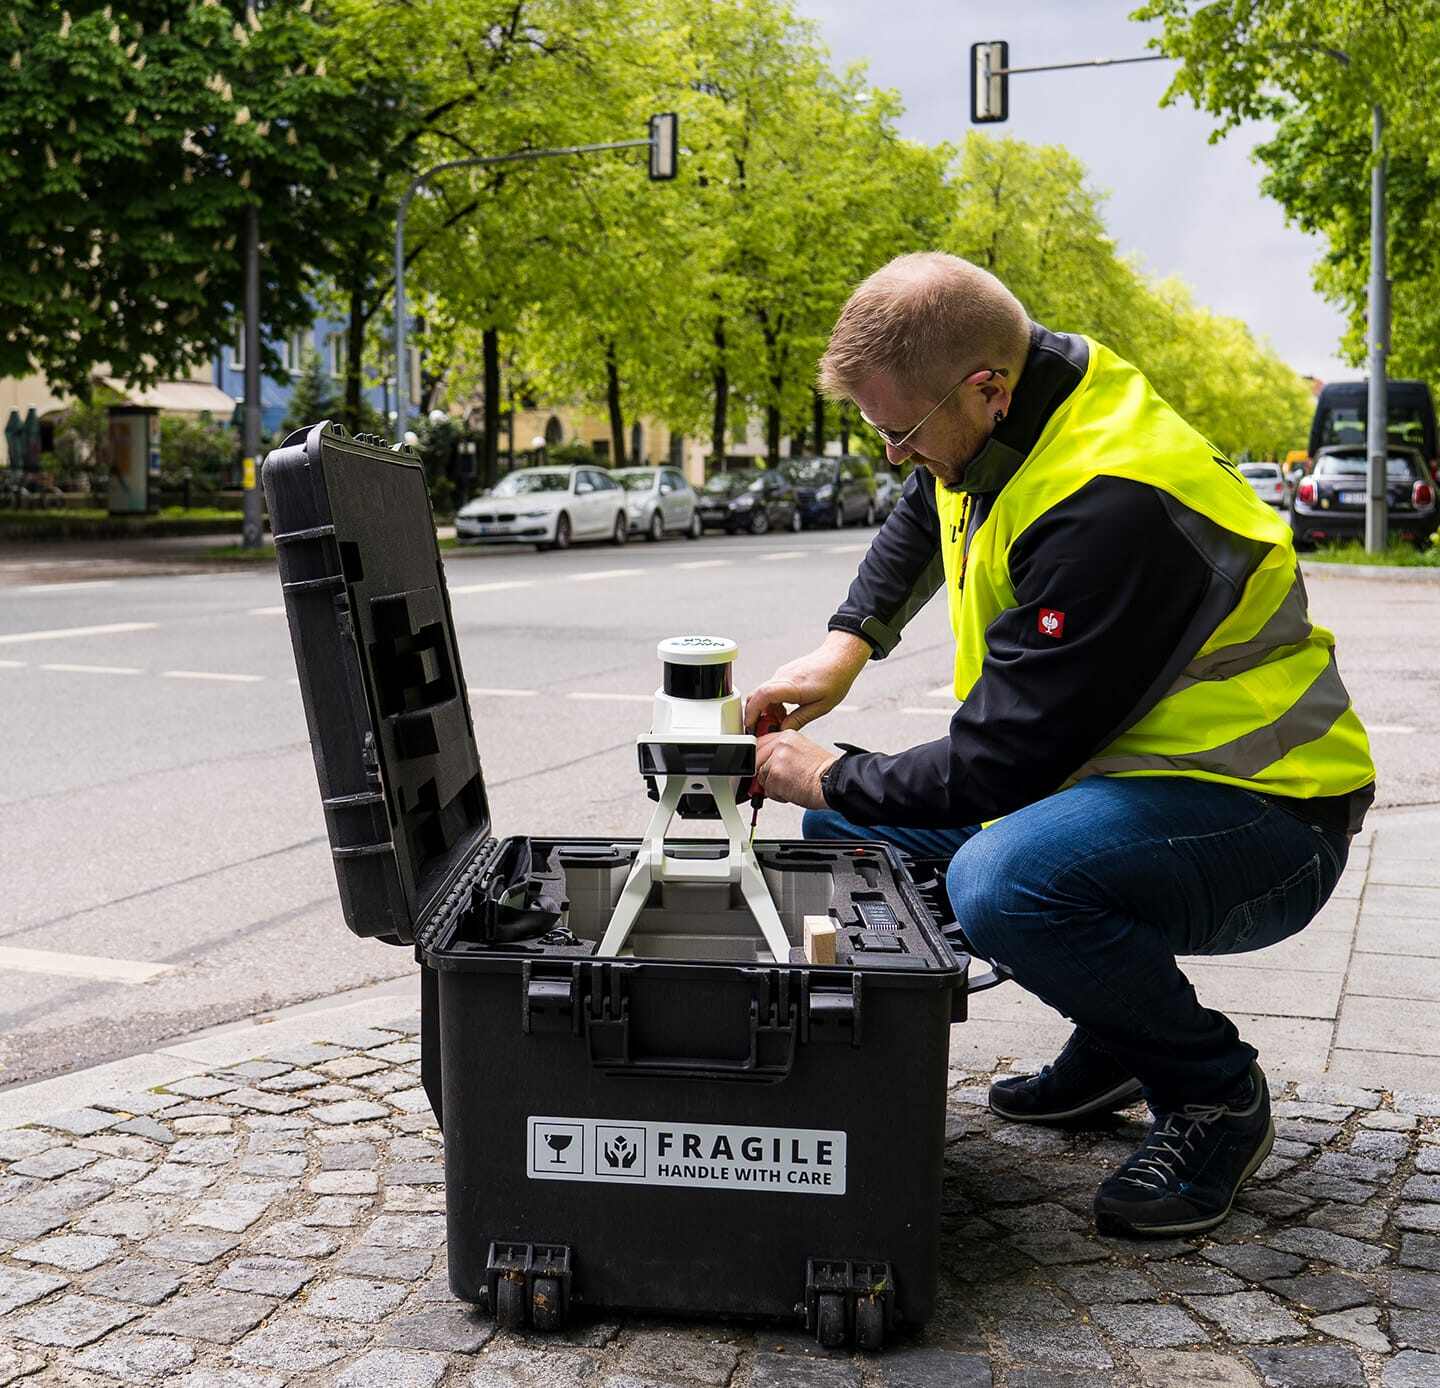
NavVis Mobile Mapping
NavVis mobile mapping systems — worn by the operator while walking through the facility — captured the extensive concourse and circulation spaces. For areas where walking speed documentation is acceptable, mobile mapping reduces scan time by an order of magnitude compared to static positions.
The NavVis data at Elland Road captured:
- 360-degree panoramic imagery for virtual walkthroughs
- Point cloud data for dimensional reference
- Automatic floor plan generation from mobile mapping trajectories
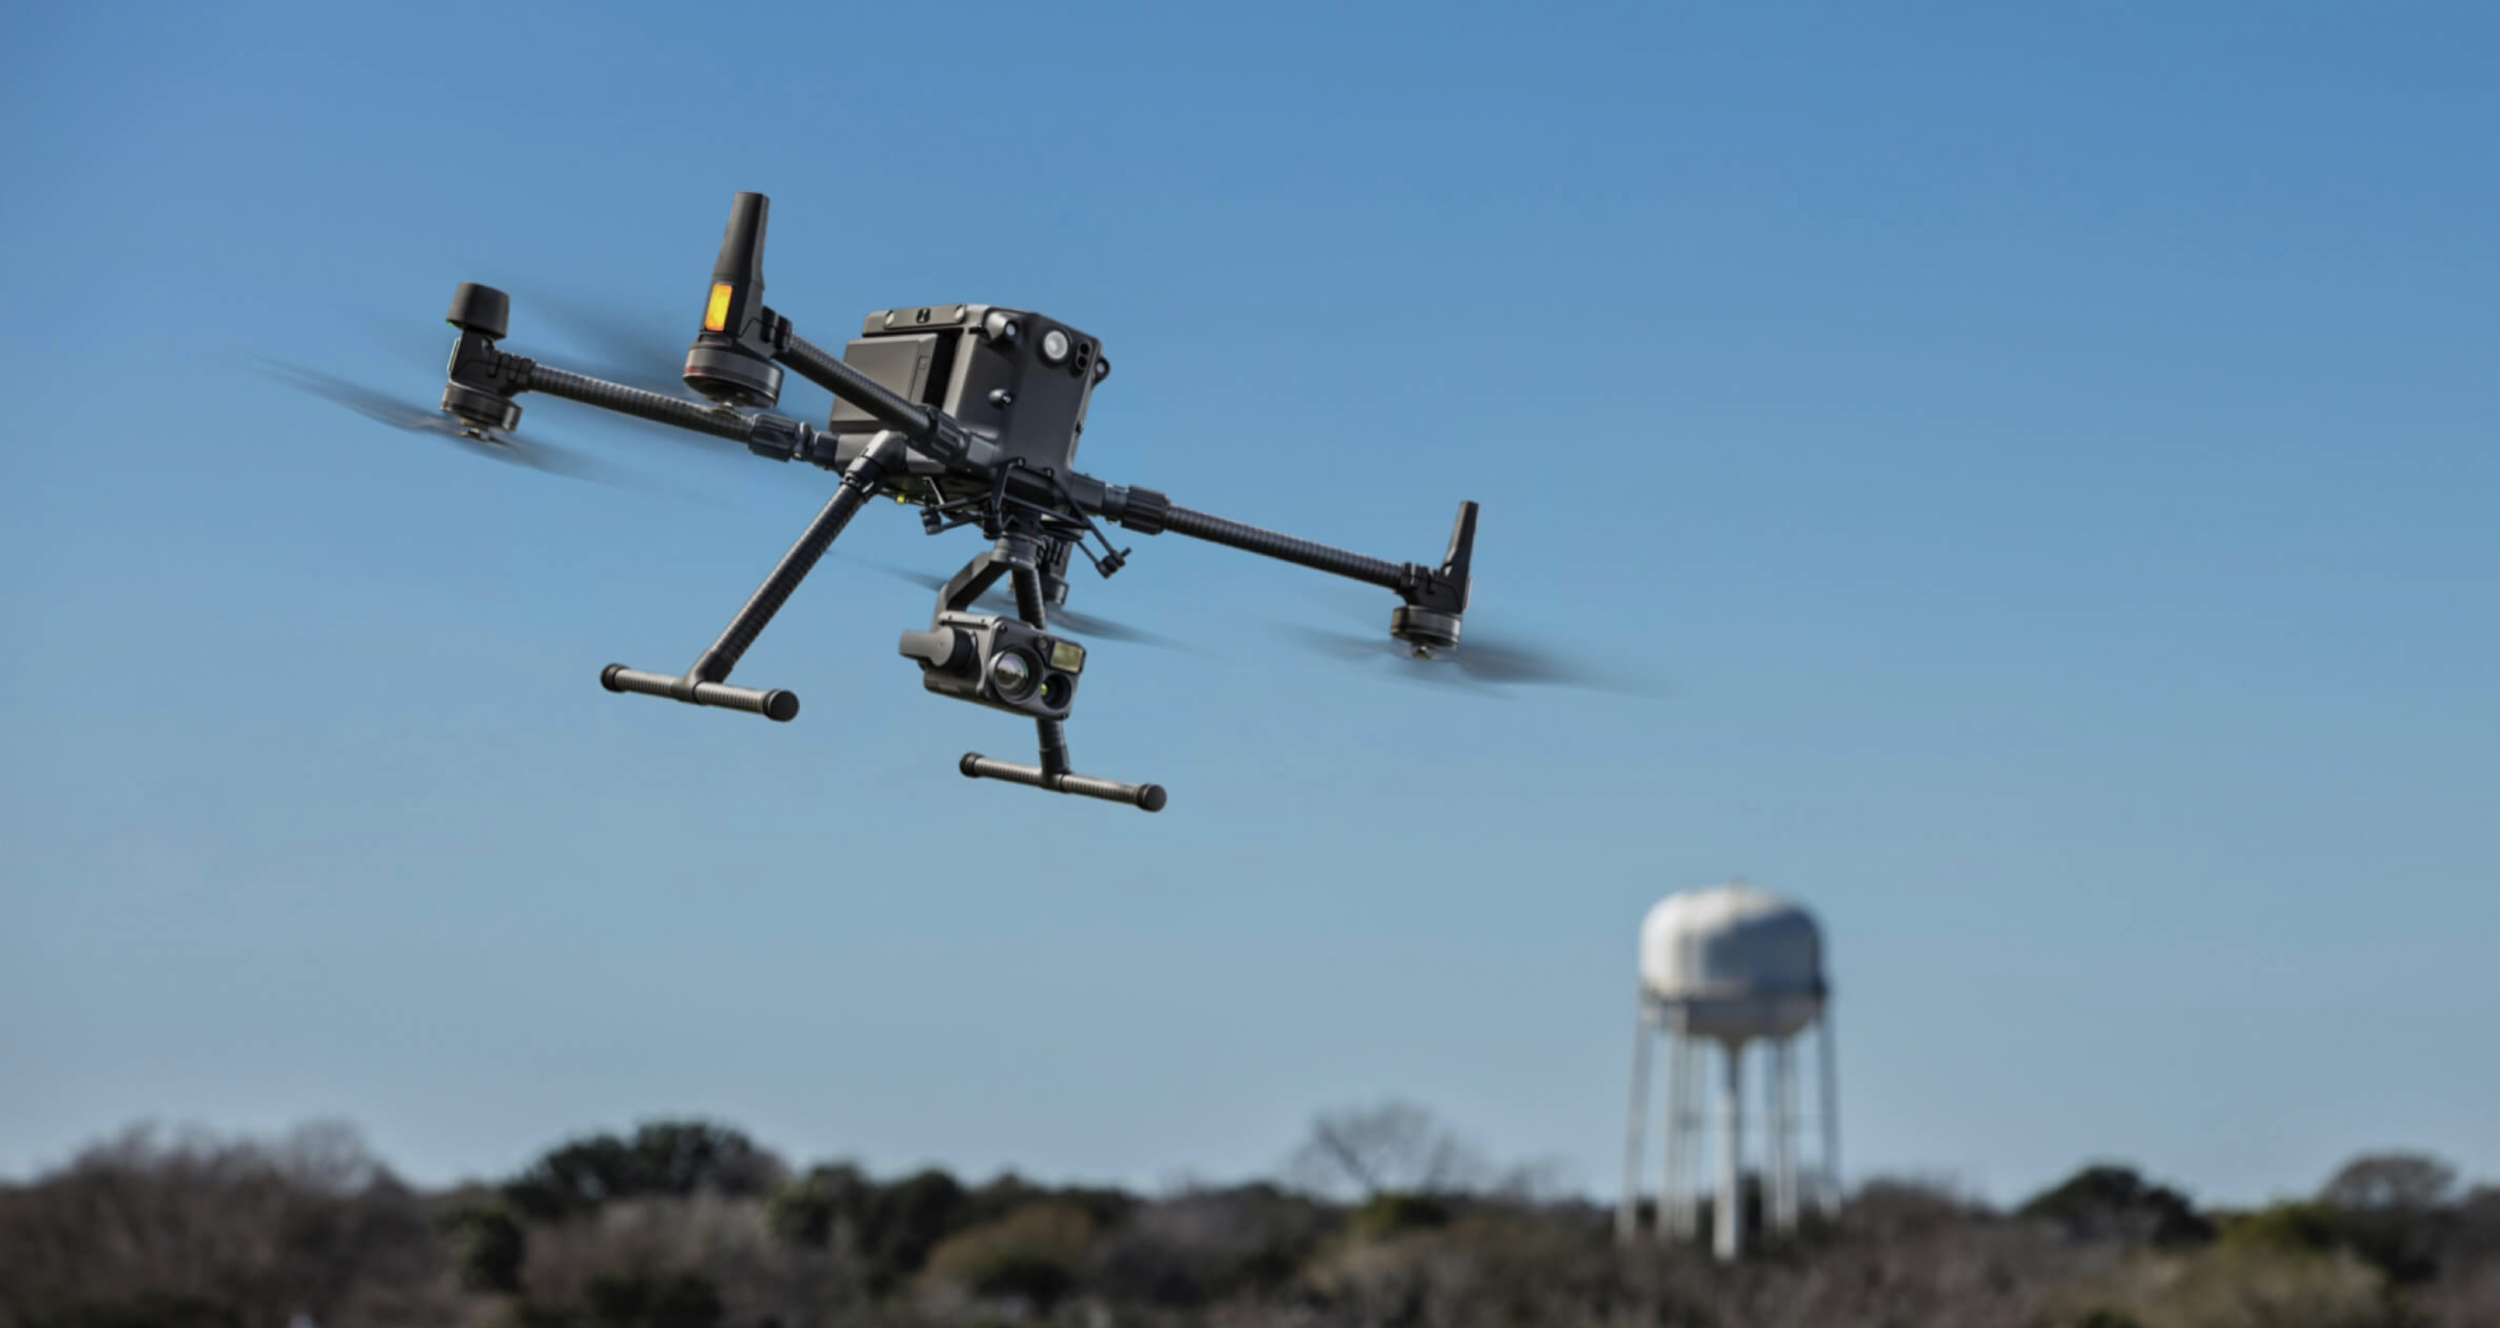
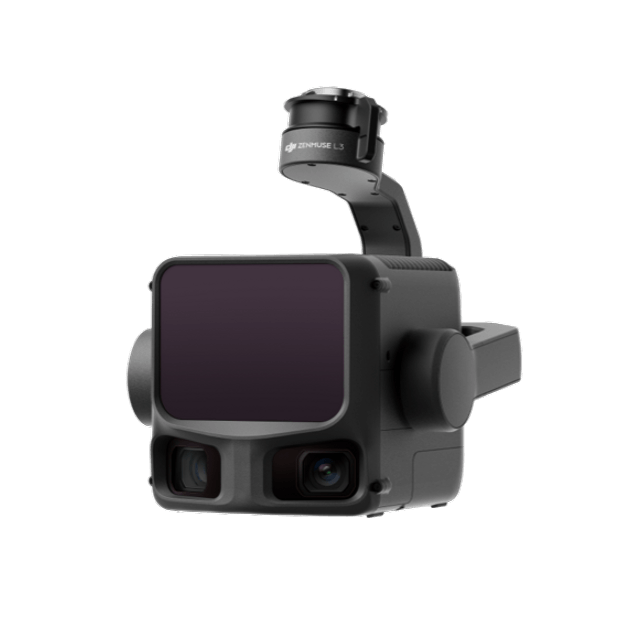
Drone LiDAR and Photogrammetry
Drone-based platforms captured the stadium exterior, roof structure, and surrounding site. The aerial data provided:
- Roof condition documentation (critical for renovation planning)
- Exterior facade geometry
- Site topography and drainage patterns
- Integration context between the stadium and its urban surroundings
Why So Many Scan Positions?
For anyone unfamiliar with laser scanning methodology, 5,250 positions sounds excessive. In practice, several factors drive the high position count in stadium environments:
1. Occlusion and Complex Geometry
Laser scanners capture what they can see from their position. In a stadium, the seating bowl geometry means that a scanner at pitch level cannot see behind the seats. A scanner in the upper tier cannot see under the cantilevered roof. Each area of the stadium creates occlusions that require additional positions to fill.
The seating bowl alone can require hundreds of positions to capture every seat, handrail, step, and structural element from angles that eliminate shadow zones.
2. Multiple Levels and Compartmentalized Spaces
A stadium is not a single open volume. It is hundreds of individual rooms and spaces connected by corridors, stairs, and ramps. Each room — whether a locker room, broadcast booth, or electrical closet — requires its own scan positions. At Elland Road, the sheer number of individual spaces across multiple levels drove a significant portion of the total position count.
3. MEP Documentation Requirements
Mechanical, electrical, and plumbing systems in stadiums are extensive and complex. Documenting these systems requires scan positions that capture pipe runs, duct routing, cable trays, and equipment from angles that reveal the spatial relationships. Mechanical rooms alone can require 20-50 scan positions each.
4. Registration Requirements
To produce a unified 3D model, individual scan positions must overlap sufficiently for the registration software to align them. In complex environments, this means scanning at closer intervals than the scanner’s maximum range would theoretically require.
Combining Terrestrial and Aerial Data
One of the critical technical challenges in stadium scanning is integrating terrestrial and aerial datasets into a single, unified coordinate system. These datasets are captured at different times, with different equipment, at different resolutions, and need to be combined seamlessly.
Control Network
The foundation for data integration is a survey control network — a series of precisely measured reference points distributed throughout the stadium. These control points serve as common reference markers that link the terrestrial, mobile mapping, and aerial datasets together.
At a minimum, a stadium control network includes:
- Primary control points: Precisely surveyed using total stations or GNSS, distributed to cover the entire facility
- Check points: Independent verification points used to assess the accuracy of the final registered dataset
- Aerial ground control: Targets visible from the air that tie the drone data to the terrestrial control network
Registration Workflow
The typical registration workflow for a stadium project follows this sequence:
- Establish control network using total station traverses and GNSS observations
- Register terrestrial scans to the control network, building up the interior model section by section
- Process drone data with RTK/PPK corrections referenced to the same control network
- Merge aerial and terrestrial datasets using common control points
- Quality control — measure known distances and compare to the scan data, verifying that the combined model meets the specified accuracy tolerance
Accuracy Considerations
Interior terrestrial scanning at a stadium like Elland Road typically achieves ±2-5mm accuracy in registered datasets. Aerial data achieves ±20-50mm accuracy depending on flying height and ground control density. The combined dataset must be qualified with an accuracy statement that accounts for the different performance levels of each sensor.
Deliverables: Point Clouds to BIM-Ready Data
The raw data from 5,250 scan positions produces a massive point cloud dataset — potentially hundreds of gigabytes. The value comes from processing this raw data into usable deliverables:
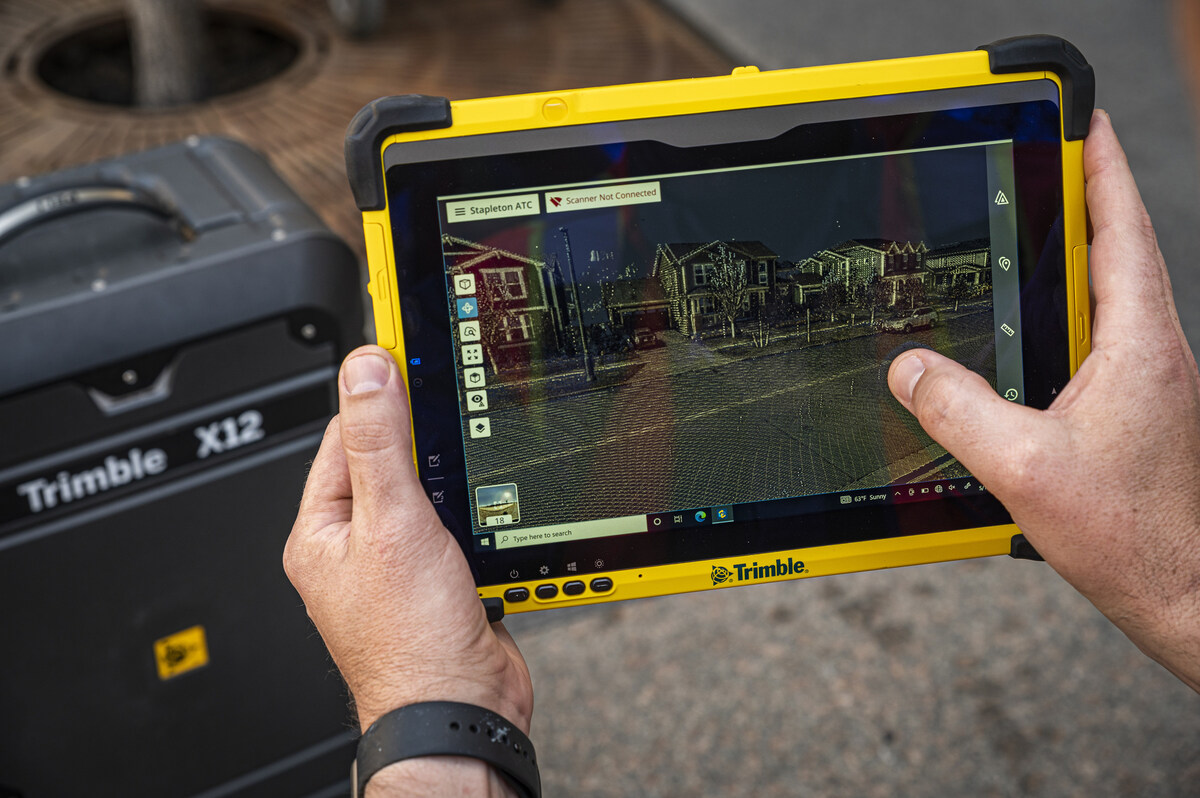
Registered Point Clouds
The primary deliverable is a fully registered, colorized point cloud in E57 or RCP format. This dataset allows architects, engineers, and facility managers to take measurements, extract sections, and explore the existing conditions in 3D visualization software.
BIM-Conversion-Ready Scan Data
For renovation projects, the point cloud is processed into BIM-conversion-ready format — cleaned, classified, and organized so that a BIM modeling firm can efficiently extract the 3D model. The scan data captures exact as-built conditions; the BIM modeling firm translates that into intelligent model elements.
Virtual Walkthroughs
Panoramic imagery captured alongside the point clouds enables virtual walkthrough capabilities. Facility managers can navigate through the stadium virtually, checking conditions in any area without a site visit.
2D Drawings
Extracted floor plans, sections, and elevations from the point cloud provide traditional 2D documentation for stakeholders who work primarily in 2D drawing environments.
What This Means for Your Stadium Project
The Elland Road project demonstrates several important principles for stadium scanning:
Scale requires planning. A 5,250-position project cannot be approached ad hoc. The scanning team needs a detailed scan plan, access schedule, and quality control protocol before arriving on site.
Multi-sensor approaches are standard. No single scanning technology efficiently captures every area of a stadium. The combination of long-range terrestrial, mobile mapping, and drone platforms is the industry-standard approach.
Control networks are critical. The accuracy of the final deliverable depends entirely on the quality of the survey control network. This infrastructure investment pays dividends in data quality.
Scope drives cost. The number of scan positions is the primary driver of field time, which is the primary driver of cost. Understanding the scan position requirements for your specific venue is essential for accurate budgeting. See our stadium scanning cost guide for detailed pricing.
Our scanning team is equipped with the same class of multi-sensor technology used on projects like Elland Road — including the Trimble X12, FARO Focus Premium, NavVis VLX3, and DJI Matrice 4E with both LiDAR and photogrammetry payloads. We have the capability and experience to handle stadium-scale documentation projects of any complexity.
Frequently Asked Questions
Why did Elland Road need 5,250 scan positions? The high position count reflects the complex geometry of a major football stadium — multiple concourse levels, compartmentalized back-of-house spaces, detailed MEP systems, and the seating bowl geometry that creates occlusions requiring additional angles to fully capture.
What scanners were used at Elland Road? The project used RIEGL VZ-600i terrestrial laser scanners for long-range capture, NavVis mobile mapping for concourse areas, and drone LiDAR/photogrammetry for exterior documentation. Learn more about stadium scanning equipment.
How long does a project of this scale take? A project with 5,250 scan positions typically requires 3-4 weeks of field work with a multi-person scanning team. Data processing and deliverable preparation adds 4-8 additional weeks.
Can every stadium expect this many scan positions? Not necessarily. The position count depends on venue size, number of levels, scope of back-of-house documentation, and MEP detail requirements. A 20,000-seat arena might require 1,500-2,500 positions. A 75,000+ seat stadium with extensive facilities could require 5,000+.
What deliverables come from a stadium scan? Typical deliverables include registered point clouds (E57/RCP), BIM-conversion-ready scan data, panoramic virtual walkthroughs, and extracted 2D floor plans and sections. The specific deliverable package depends on the project’s downstream use.
Explore our complete stadium scanning services, including dedicated pages for interior 3D laser scanning and aerial LiDAR scanning. For an educational overview, read our stadium scanning guide.
Ready to Start Your Project?
Get a free quote and consultation from our 3D scanning experts.
Get Your Free Quote